![]()
https://www.ons.gov.uk/peoplepopulationandcommunity/personalandhouseholdfinances/incomeandwealth/bulletins/householddisposableincomeandinequality/yearending2018
Average household income, UK: Financial year ending 2018 Final estimates of average household income in the UK, with analysis of how these measures have changed over time, accounting for inflation and household composition. https://www.ons.gov.uk/peoplepopulationandcommunity/personalandhouseholdfinances/incomeandwealth/bulletins/wealthingreatbritainwave5/2014to2016 Wealth in Great Britain Wave 5: 2014 to 2016 Main results from the fifth wave of the Wealth and Assets Survey covering the period July 2014 to June 2016. https://www.ons.gov.uk/peoplepopulationandcommunity/personalandhouseholdfinances/incomeandwealth/bulletins/theeffectsoftaxesandbenefitsonhouseholdincome/financialyearending2019 Effects of taxes and benefits on UK household income: financial year ending 2019 The redistribution effects on individuals and households of direct and indirect taxation and benefits received in cash or kind, analysed by household type and the changing levels of income inequality over time. Income estimates for small areas, England and Wales: financial year ending 2018 Small area model-based income estimates covering local areas called Middle layer Super Output Areas (MSOAs) in England and Wales. https://www.ons.gov.uk/peoplepopulationandcommunity/personalandhouseholdfinances/incomeandwealth/bulletins/smallareamodelbasedincomeestimates/financialyearending2018 Employee earnings in the UK: 2019 Measures of employee earnings, using data from the Annual Survey for Hours and Earnings (ASHE). https://www.ons.gov.uk/employmentandlabourmarket/peopleinwork/earningsandworkinghours/bulletins/annualsurveyofhoursandearnings/2019 Average household income, UK: financial year ending 2019 Estimates of median and mean disposable income for people in the UK for the financial year ending 2019. https://www.ons.gov.uk/peoplepopulationandcommunity/personalandhouseholdfinances/incomeandwealth/bulletins/householddisposableincomeandinequality/financialyearending2019 Analysing regional economic and well-being trends How UK regions and countries vary in performance on economic and wellbeing indicators, and how this trend has changed over time. https://www.ons.gov.uk/economy/nationalaccounts/uksectoraccounts/compendium/economicreview/february2020/analysingregionaleconomicandwellbeingtrends https://www.ifs.org.uk/inequality/geographical-inequalities-in-the-uk/ 3 AUGUST 2020 Catching up or falling behind? Geographical inequalities in the UK and how they have changed in recent yearsThe COVID-19 crisis has brought to the fore increasing concerns about inequalities not only between different population groups – such as the gap between the rich and poor, young and old, and different ethnic groups – but also between people living in different places. Even prior to the crisis though, there was a sense that the UK is not only a highly geographically unequal country, but also an increasingly geographically unequal one. Such concerns are of significant political import. The Johnson government has made ‘levelling up’ the economy, living standards and life chances across the country a mantra, and has announced a review of guidance for infrastructure investment aimed at increasing the proportion going to the Midlands and North of England. But just how geographically unequal is the UK? Is it true that these inequalities have been getting worse? Are there particular regions or types of places that have been doing particularly well or poorly? And what risks of widening and opportunities for narrowing these gaps might the COVID-19 crisis bring? Focusing on productivity, earnings and household incomes, this report finds that: Geographical inequality in incomes is much lower after accounting for variation in housing costshttps://eprints.lse.ac.uk/28344/1/CASEreport60.pdf https://www.equalitytrust.org.uk/scale-economic-inequality-ukThe Scale of Economic Inequality in the UKUK Income InequalityThe UK has a very high level of income inequality compared to other developed countries. The majority of households in the UK have disposable incomes below the mean income (£34,200 as of 2018). This includes wages and cash benefits, and is after direct taxes like income tax and council tax, but not indirect taxes like VAT. The median income has been rising by 2.2% on average for the last five years. Most of this is accounted for by the rise in average income for the richest fifth, which has increased by 4.7%. The poorest fifth, on the other hand, have seen a fall in income by 1.6%[1]. In 2018, households in the bottom 20% of the population had on average an equivalised disposable income of £12,798, whilst the top 20% had £69,126. As can be seen from the graph below when original incomes are compared, the difference is even more striking: the richest fifth had an income more than 12 times the amount earned by the poorest fifth[2].
0 Comments
![]()
Moduloft is committed to the Entry Level budget home ownership Market. Delivering affordable Homes and the means to Finance them literally without costing the earth. Moduloft is Green by design, and Affordable by design , we are experts in materials passports, Energy based economics and Place-making. We do have questions though regarding the Agenda 2030 sustainable development goals and whether financial products are being developed for our Customer price point. This coming week we will publish a series of discussion papers surrounding the question. Is 21st Century Britain, in 2021, going to be a Home Owning democracy or a Rent seeking Banana Republic?
Moduloft a Manufacturing and Customer Financing solution to enabling owner occupation for the Reluctant 10 per-centers. “our product is aimed at what we call the reluctant 10 per-centers and what i mean by that is if you envisage the property ladder as 100 rungs, since 2009 home ownership has fallen from 75% of occupation to 65% so there were 25% of people in the rental sector across all types of rental property in 2009 now in 2020there are 35 percent and it occurred to me that those 10%of people, that 10 rungs of the property ladderwould rather buy than rent and so what we've addressed the reasons why they haven't been buying and have been renting instead”
Roger Lewis , CEO Moduloft
#Moduloft The Concept. #Cop26 Draft No.1 Presentation and discussion #BuildBackBetter #LevellingUp https://www.yumpu.com/s/YVK6NcySvUb3lAfd
Moduloft Finance Affordable Finance A Framework of Understanding Moduloft Finance Affordable Finance A Framework of Understanding
https://www.yumpu.com/s/fX4Ajc3WKEkQsdx5
#Moduloft The Concept. #Cop26 Draft No.2 notes Presentation and discussion #BuildBackBetter #LevellingUp
https://www.yumpu.com/s/PLnOvZY46eu3BVSH
Housing Market Fundamentals including Debt. From Shiller’s Irrational Exuberance to The Covid19 Debt Bomb.#COP26 Moduloft Primer.
https://www.yumpu.com/s/GijaAsXQH4tp6vJ7
Primer INDEXED UNITS OF ACCOUNT: THEORY AND ASSESSMENT OF HISTORICAL EXPERIENCE, Property Values and Indexation
https://www.yumpu.com/s/7i2JUxtPoQesY5vf
#COP26 Presentation Embodied Energy, Embodied Carbon Building Information Modelling (BIM) Technical Framework Sourcebook
https://www.yumpu.com/s/dPU5rugzLGTQWvha
Help to Buy and other Schemes.
Are we Looking for and have we been looking for solutions?
" In this response, it is assumed The Committee is seeking to further the public interest, even where this may conflict with the private interests which usually dominate the analysis and debate. This will pose a major challenge to those who have learned their analysis exclusively through channels devoted to promoting private interests, and must “unlearn” erroneous but pervasive assumptions and principles."
the distinction between Bank, Building society and Other lending in all the stats is key, followed up by the Distinction between, Mortgage for New or Existing homes as 1st Mortgages,Mortgages for Remortgages and finally mortgages for Letting investments. The other very important distinction is Mortgage Funds secured in the Money Markets and Mortgages originated as Bank credit. Northern Rock of course famously became a casualty of the former and The Market itself is in my opinion enslaved to the latter. One further Stratification category would be the Element of Value attributable to Site or Land Value. All of my recent researches point to Land Value Tax, and the Late Dr Adrian Wrigley’s work. This paragraph is sandwiched between Two Quotes from Adrian's work.
"Evidence of a real housing “shortage” is absent. A real shortage would show up as overcrowding nationwide. People would be walking the streets in the hope of finding a room. Room prices would be high, and there would be no empty houses.We have a crisis of affordability and allocation. People are borrowing eight times their income to get on the housing ladder yet there are 700,000 derelict houses, 500,000 second homes, and hundreds of thousands of pensioners’ homes with at least three bedrooms spare. The overheated Spanish housing market shows that rapid building programmes do not cure price bubbles".
For an Affordable Product to work the appropriate supply of newly created credit needs to be accessible for new first time buyers. It is the successive failure to solve or even address this piece of the puzzle that has led to the Market as we see it today. By some estimations ( Werner et al) the cause of the Gyrations we call the property cycle, is the availability of Credit, Bankers and Policy makers/regulators are to blame.
At this point separating the Flows of Credit into the Housing Market is a non trivial task As one has to Factor in The Production Side of the equation; House builders/Developers etc. with financing of Land Acquisition, Planning and Construction. Understanding these flows and incorporating them into a model to see how the Split between; Newly created Credit and Institutional Equity Funding expressed as Developer Payments, Insurance Company Liability cover ,and Other risk Capital from the Players in the Model Transaction create a complex dynamic system where much of the Devil is found in the detail. Simple indices, median prices and Stylized Facts all contribute to the confusion and ultimately have succeeded in throwing the Baby out with the bathwater.
I think if workable solutions have or can be developed then any workable solutions should all satisfy one proviso.
• Higher LTV lending and also Lending at Higher Joint income Multiples is a necessary combination if First Time buyers are to see sufficient credit allocation.
The Macro Prudential framework as it currently exists , will I think frustrate even prudent and attractive Mortgage products for First Time buyers. My Latest Blog touches on the Problem. Per Kurowski who I quote in the Blog is an ex director of the World Bank and If the Good Ship Sonia is to set sail, we could do a lot worse than pay heed to Pers message which he has oft repeated in the letters section of the FT.
“With lower bank capital requirements for residential mortgages than for loans to the entrepreneurs or SMEs, those who can create the jobs needed in order to service utilities and mortgages, you will not have a functional economy, and houses have morphed from being affordable homes into being the main risky-investment of way too many families.”
The Stylized Facts of the Macro Prudential Literature , succeeds in doing what Stylized Facts do. That is The decoupling of The Entry levels of the Market from Fundamentals has gone un-diagnosed. I am not convinced that this is not condoned by implicit policy, where being seen to be trying to do something is enough, Actually doing something is not the standard of success, a triumph of Stylized Facts over Substance, Perhaps? https://notthegrubstreetjournal.com/2020/12/18/a-ship-in-harbor-is-safe-but-that-is-not-what-ships-are-for-setting-sail-on-the-good-ship-sonia-perkurowski/ “A ship in harbor is safe, but that is not what ships are for”,. @PerKurowski Tackling the UK housing crisis: is supply the answer?
5.” The collapse in home ownership was mainly due to withdrawal of mortgage finance from FTBs, which suggests policymakers face a trade-off. This paper has argued that, while high house prices affect home ownership, the dominant driver of its recent collapse was a sudden stop on mortgage lending to FTBs. And in keeping with that explanation, the recent return to a more normal pace of FTB lending has seen the home ownership rate stabilise and perhaps begin to recover". Ian Mulheirn August 2019 The new focus of RLD "placemaking" is as described in the recent article in Property Week. More Specifically. Over the past 25 years a Gap has opened in the market between what is affordable and what is built to address the shortage of Affordable Residential property. The Definition of help to buy in london is a range up to 600k. Development has gone high rise and targeted at the Buy to rent markets often specifically for investors in the Far East. Or Buy to Let landlords in the UK. S 106 provision of Affordable Social Housing has not addressed the dynamics of a housing market where the children of families can remain within communities. This problem has been known about with attempts to address it in Rural areas where Holiday home and second home buyers price out Villagers. In Urban Centres Commutes have got longer and more expensive. This recent "Action on Empty homes" report nails the problem in my opinion. Action on Empty Homes campaigns for more empty homes to be brought into use for people in housing need. Our aims are to: ■ Raise awareness of the waste of long-term empty homes. ■ Campaign for changes to national policy. ■ Support loca o: ■ Raise awareness of the waste of long-term empty homes. ■ Campaign for changes to national policy. ■ Support local communities in transforming their neighbourhoods. ■ Provide advice for those seeking to bring empty homes back into use. ■ Research and develop ideas for bringing long-term empty homes back into use for those in housing need. https://www.actiononemptyhomes.org/Handlers/Download.ashx?IDMF=24ace1b7-b428-4fee-8dcc-6a7638f32eaa If people make places and communities ( I think that they do), then the provision of the basic spaces for communities to "Make their own" over time is the essence of our new concept. Our Budget Live Work Thrive "Be the event" comprehensive development approach of Placemaking Basics by for and of the people and their community. In Urban contexts and in Suburban or rural contexts the same basic principles apply.
![]() Are we Looking for and have we been looking for solutions? 13. In this response, it is assumed The Committee is seeking to further the public interest, even where this may conflict with the private interests which usually dominate the analysis and debate. This will pose a major challenge to those who have learned their analysis exclusively through channels devoted to promoting private interests, and must “unlearn” erroneous but pervasive assumptions and principles. Evidence of a real housing "shortage" is absent. A real shortage would show up as overcrowding nationwide. People would be walking the streets in the hope of finding a room. Room prices would be high, and there would be no empty houses.We have a crisis of affordability and allocation. People are borrowing eight times their income to get on the housing ladder yet there are 700,000 derelict houses, 500,000 second homes, and hundreds of thousands of pensioners’ homes with at least three bedrooms spare. The overheated Spanish housing market shows that rapid building programmes do not cure price bubbles. the distinction between Bank, Building society and Other lending in all the stats is key, followed up by the Distinction between, Mortgage for New or Existing homes as 1st Mortgages,Mortgages for Remortgages and finally mortgages for Letting investments. The other very important distinction is Mortgage Funds secured in the Money Markets and Mortgages originated as Bank credit. Northern Rock of course famously became a casualty of the former and The Market itself is in my opinion enslaved to the latter. For an Affordable Product to work the appropriate supply of newly created credit needs to be accessible and it is successive failure to solve or even address this piece of the puzzle that has led to the Market as we see it today, and is by some estimations ( Werner et al) the cause of the Gyrations we call the property cycle. At this point separating the Flows of Credit into the Housing Market is a non trivial task As one has to Factor in The Production Side of the equation Housebuilder/Developers and financing of Land Acquisition, Planning and Construction. understanding of these flows into a model to see how the Split between; Newly created Credit and Institutional Equity Funding expressed as Developer Payments, Insurance Company Liability cover , and Other risk Capital from the Players in the Model Transaction One Replacement scheme for the Government's Help to Buy Scheme was explained to me this week, Having explained in more detail how their solution for a replacement for home Help to buy would work in practice, I was impressed by the proposal but gad one question and reservation. I think if a solution has been developed a workable Solution should satisfy one proviso.
![]()
December 2015 The Bank of England’s approach to setting a minimum requirement for own funds and eligible liabilities (MREL) Consultation on a proposed Statement of Policy ![]() ![]() ![]() ![]() ![]() ![]() ![]()
![]()
#Tautology #CircularReasoning #RobbingPetertoPayPaul #MoneyisanAbstractRatio #CentralBankCoup #COP26 #ReithLectures #BraveNewWorldofCarbonTrading #SPASH #WrongKindofGreen #MODULOFT #AffordableHomes #CreditMisallocation #EphorsofDebt #EuroCrisis #Brexit #CronyCapitalistVirus
To Be Continued this is a Notebook Post , as have so many of my posts been this past two months. @LondonRealTV , @BrianRose4Mayor on London's Housing Market. #Moduloft #AffordableByDesign12/16/2020 ![]() Hello Brian, I have watched the Modular Housing and Affordable Housing Video downloads. #Moduloft is a Company I have started to tackle this problem. The Solution is one of Ownership versus Tenancy both related to disposable income and also Finance. Finance for Build to Rent has not been a problem, Finance for Owner occupation Mortgages (somewhat of a problem). The Delivery Path for housing is also one of several bureaucratic Layers. The GLE / Mayoral Level being but one. If you would like to discuss the Policy framework affecting this question at all levels feel free to call me. https://notthegrubstreetjournal.com/2020/12/16/moduloft-the-affordable-housing-manufacturers-defining-the-terms-of-and-boundary-conditions-of-our-domain-2/ Sadiq Khan is shining a light in all the wrong areas, Don't make the same mistake. The problem remains unsolved, This is absurd, its not rocket science. When something such as the current problem emerges across several decades and actually gets worse it is not because policy makers are stupid , it is that other less popular policies are given precedence. Believe it or not to see what the Policy areas are for this , One has to look at the Covered Bond markets, and the concepts of Land Value Capture ( Community Infrastructure Levy) . Good luck with your campaign, you are very much in danger of Over promising here on Timescales, I question how wise that is. I have published a series of Primer/Readers on the areas effecting these questions. Mine are Free Market solutions and for profit I achieve this by placing my Customers First Time Buyers and Starter Home purchasers first.
![]()
One day in 1871 George went for a horseback ride and stopped to rest while overlooking San Francisco Bay. He later wrote of the revelation that he had: I asked a passing teamster, for want of something better to say, what land was worth there. He pointed to some cows grazing so far off that they looked like mice, and said, "I don't know exactly, but there is a man over there who will sell some land for a thousand dollars an acre." Like a flash it came over me that there was the reason of advancing poverty with advancing wealth. With the growth of population, land grows in value, and the men who work it must pay more for the privilege.[34]https://en.wikipedia.org/wiki/Progress_and_Poverty In his 1946 foreword to Brave New World, Aldous Huxley writes "If I were to rewrite the book, I would offer the Savage...the possibility of sanity...where community economics would be decentralist and Henry-Georgian".
@rld_real_CPR. @ArtistGilly.
![]()
#AuthenticPlaceMaking #PlaceMakingBasics #RealRLD #SkinInTheGame
I wrote this following bit in 2011.
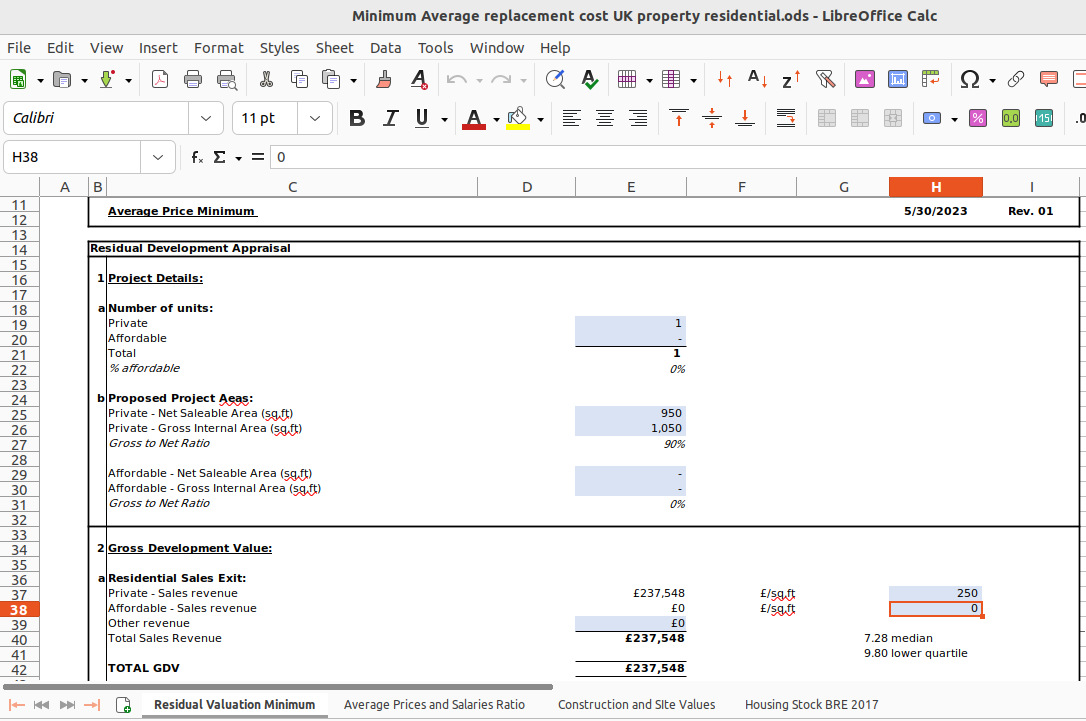
Some people say a crash in house prices is necessary as a Valuer that has valued Oil refineries and Gas Terminals in another life I have one comment on that. There is a way of calculating the base market price on a real asset such as property the logical lower end price or entry price for property is not zero just as the maximum price must be related in some way to income multiples. ( my final year thesis for my degree was the Contractors Principle of Valuation for Taxation of Gas Terminals in Scotland, I had been employed by one of the Seven sisters. ) My very simple contention is that the basic price of a property in a market where there is no longer any activity.In a crashed or stagnant market supply and demand does not provide a Market price of comparable transactions in this situation the economic replacement cost of the property needs to be refrenced. This is a fairly easy thing to calculate there is a thing called Spons an almanac of prices/costs for the contracting world) that gives average building materials and labour costs for building. Today I would say £150 persqft would be a sensible price per square foot for a fairly traditional british house build there are cheaper ways and better ways to build but this is a first principles 101. The price of any property has a land element generally this is around 1/3rd of the total price any amount of sophisticated analysis will get you a variation around this figure and so on but the humble 1/3rd 1/3rd 1/3rd usually brings home the bacon so I’ll use it here so that then is £150 psft for the land element. Finally there is the last 1/3rd which is for the unknowns opportunity cost and profit. If we want to take the profit out again the maths to do that is easy but I’ll leave it as a 1/3rd for now. Right that gives a base cost pers sqft of £450 per sqft. For a more basic budget build one could argue for £100 per sq ft giving £300 pers sqft . Anyway if we say take £275 psf which is very low and in all probability below the actual economic replacement cost if you take a 750 sqft 2 bedroom apartment that would be a bottom line economic replacement cost value of £206,250. Regardless of anything people need somewhere to live in the future and an economic value has to be placed on production my question is this what policies going forward an banking system will support the proposition that every family should at least have a 2 bedroom family home and the cost of providing it would be roughly the figure I am suggesting if one factors in the opportunity cost for instance the government has lots of land it could contribute for free but its value still has to be recognised even if not charged for. These are open Market prices and assumptions but provision of housing has to be priced some way and I do plan to get into some analysis of the Affordable so called social housing side fo the equation as I say this is a first principles starting 101. I am going to develop this hypothesis further but just wanted to get it on paper going forward from this blog, in a melt down of the banking system and complete crash of the UK property market these first principles of economic replacement cost will be necessary to avoid a huge potential scam. And Here we are now in December 2020 9 and a half years later. I have indeed been developing this Hypothesis further. Moduloft Finance Affordable Finance A Framework of Understanding (First Draft Still Proof Reading)
Negative equity
https://en.wikipedia.org/wiki/Negative_equity Negative equity is a deficit of owner's equity, occurring when the value of an asset used to secure a loan is less than the outstanding balance on the loan.[1] In the United States, assets (particularly real estate, whose loans are mortgages) with negative equity are often referred to as being "underwater", and loans and borrowers with negative equity are said to be "upside down". People and companies alike may have negative equity, as reflected on their balance sheets.
History The term negative equity was widely used in the United Kingdom during the economic recession between 1991 and 1996, and in Hong Kong between 1998 and 2003. These recessions led to increased unemployment and a decline in property prices, which in turn led to an increase in repossessions by banks and building societies of properties worth less than the outstanding debt.[2] Since 2007, those most exposed to negative equity are borrowers who obtained loans of a high percentage of the property value (such as 90% or even 100%). These were commonly available before the credit crunch.
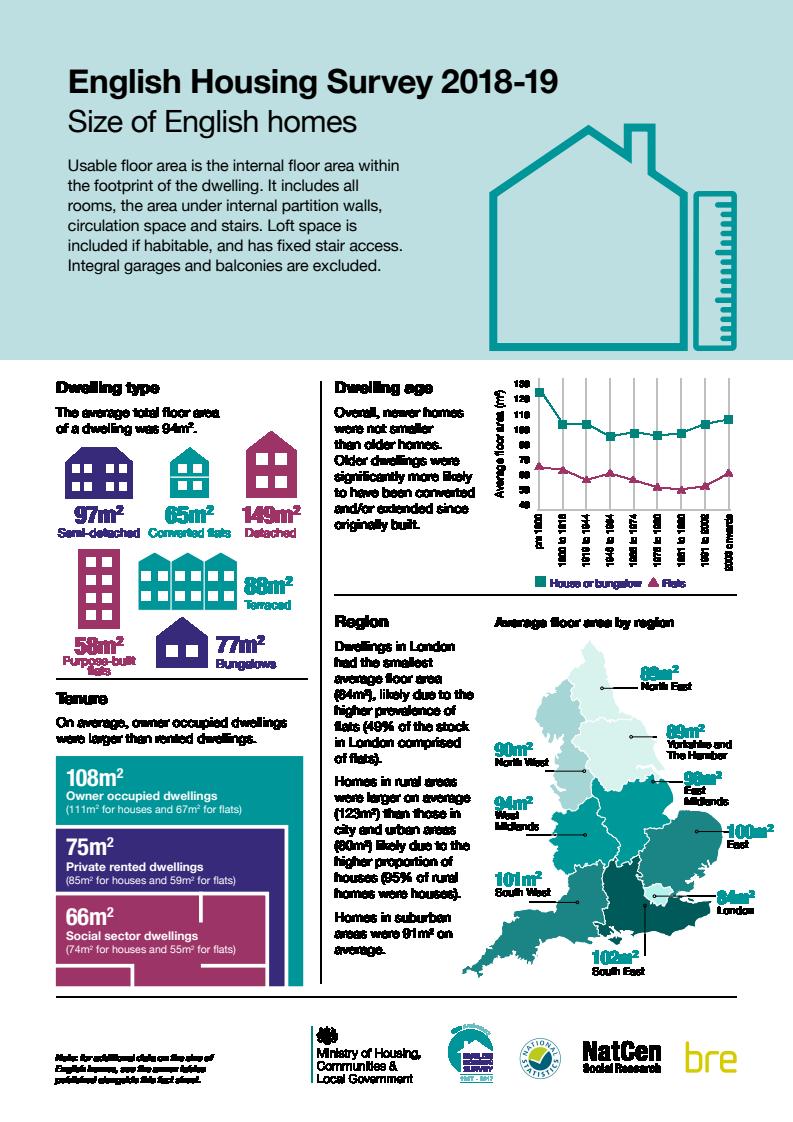
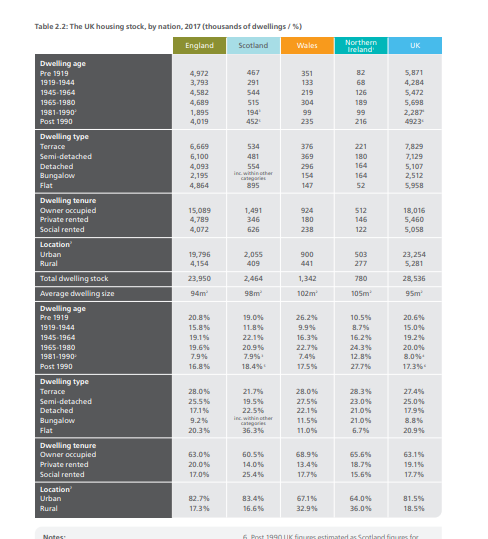
![]() NO PART of the financial crisis has received so much attention, with so little to show for it, as the tidal wave of home foreclosures sweeping over America. Government programmes have been ineffectual, and private efforts not much better.Now it is Barack Obama's turn. On February 18th he pledged $75 billion to reduce the mortgage payments of homeowners at risk of default. Lenders who help people to refinance their mortgages will receive matching subsidies from the government. These could reduce a borrower's monthly payments to as little as 31% of their income, and last for up to five years. ![]() ![]() Latest estimates suggest that the number of homeowners affected - which increased sharply after the 1992 election with house prices dropping more than 15 per cent- has more than halved to below half a million this year. Negative equity could be history by next May. The conventional wisdom is that house prices will continue to rise steadily without a return to boom conditions. The reasoning is that the bust is still too fresh in buyers' memories, so few will be willing to offer silly prices. In addition, the signs that the pent-up demand from buyers is being released should be met with pent-up supply from people who have been unable to move for the past five years. David Miles, professor of economics at Imperial College, thinks this is a straw in the wind. House-price inflation could soar beyond the 5 to 7 per cent that most economists are forecasting. "You can't explain past frenzies unless you assume people do have very short memories," he says. "Once first-time buyers see that prices are definitely rising, they will come into the market and it will become a self-fulfilling boom." Even if the late 1990s turn out to be a pale shadow of the late 1980s, house prices will almost certainly stay ahead of inflation. That is their long-run trend in a country where earnings increase and land is in fixed supply. And after the housing nightmare of the past five years, there is some catching up to do. ![]() History The term negative equity was widely used in the United Kingdom during the economic recession between 1991 and 1996, and in Hong Kong between 1998 and 2003. These recessions led to increased unemployment and a decline in property prices, which in turn led to an increase in repossessions by banks and building societies of properties worth less than the outstanding debt.[2] Since 2007, those most exposed to negative equity are borrowers who obtained loans of a high percentage of the property value (such as 90% or even 100%). These were commonly available before the credit crunch. ![]() 3.2.2 Measuring the debt-equity ratio and negative equity. One commonly used definition of the ratio of mortgage debt to housing equity measures equity by the estimated value of the residential housing stock owned by the household sector (as published in the National Income and Expenditure Blue Book, and interpolated to a quarterly frequency). A substantial proportion of owners of housing equity, however, have no mortgages. We prefer, therefore, to adopt a measure defined as the average mortgage for those with mortgages relative to the average house price. We take the mix-adjusted index of second-hand house prices, normalized to the average value of houses traded in some year, as a proxy for the average house price of mortgaged properties. An estimate of the proportion of mortgages in negative equity can be derived from the average debt equity ratio, using equation (4). The coefficients λ and λ0 can be calibrated approximately to match estimates of the proportion of households with negative equity. CML research (Tatch 2009) suggests that between 7.6 percent and 10 percent of UK mortgages were in negative equity in February 2009 (using Halifax and Nationwide house price indices, respectively, for the fall in UK house prices between December and February). CML previously estimated a peak of 17 percent of mortgages with negative equity in the early 1990s. A figure of 9 percent is assumed for 2009Q1 and 15.5 percent for 1995Q4, to calibrate λ and λ0. 18 The debt equity ratio defined by the average mortgage to average house price is plotted in Figure 6, with the implied proportion in negative equity from equation (4). The calibration implies 9 percent of mortgages were in negative equity in 2009Q1 compared with 1.5 percent in 2002Q4 and 15.5 percent in 1995Q4. Comparable figures at the same dates for the debt equity ratio were 71.4 percent, 51.6 percent and 77.9 percent. Moves in the proportion in negative equity become more pronounced as the average debt equity ratio rises, due to the non-linearity of their relationship, see equation (4). One further small adjustment is made in the assumed relationship between negative equity and the ratio of average debt to average equity. It seems likely that a high number of recent possessions would have temporarily depleted the count of mortgages in negative equity, below those implied by the average debt-equity ratio. To take account of this, we subtract the cumulated number of possessions cases over the previous two years19, scaled by the number of mortgages outstanding, from the proportion of negative equity implied by equation (4). To illustrate the magnitudes implied by this research, a 10 percent increase in the debt-service ratio, for example due to the mortgage interest rate rising from 4 percent to 4.4 percent, is estimated eventually to raise the possessions rate by around 19 percent, and the 6 month arrears rate, corrected for measurement bias, by 15 percent. This calculation holds the proportion of mortgages in negative equity and the unemployment rate fixed. At 2009Q3 house price and debt levels, a fall in house prices of 1.4 percent would raise the proportion of mortgages with negative equity from an estimated 8.5 percent to 9.35 percent, a 10 percent proportionate increase. An increase of this magnitude in the rate of negative equity is estimated eventually to increase the possessions rate by 7 percent and the 6 month arrears rate by 3.5 percent. A ten percent increase in the unemployment rate from 8 percent to 8.8 percent is estimated to increase the possessions rate by 2 percent32 and the 6 month arrears rate by 10 percent. ![]() ![]() ![]() ![]() ![]() ![]() Moduloft, The Affordable Housing Manufacturers. Defining the Terms of and Boundary Conditions of our Domain.![]() The outstanding value of all residential mortgage loans was £1,527.3 billion at the end of 2020 Q3 two thirds of households own the house they live in; half of these are still paying off their mortgage 28,536,000 Dwellings 29,180,071,800 sq ft 29 Billion Sqft . ![]() ![]() ![]() 29,180,071,800 sq ft 29 Billion Sqft .Plot Size and Dwelling Size ![]() ![]() ![]() ![]() ![]() ![]() ![]() ![]() ![]() ![]() ![]() A second innovation is the theory-justified use of an estimate of the proportion of mortgages in negative equity, based on an average debt to equity ratio, as one of the key drivers of possessions and arrears. Possessions and arrears are driven by three economic fundamentals: the debt service ratio; the proxy for the proportion of mortgages in negative equity, calibrated from an average debt to equity ratio; and the unemployment rate. Modelling the three equations as a system with common lending quality and policy shifts helps greatly in the identifying the unobservables. By sharp contrast with earlier UK literature, there is no significant effect on the rate of possessions from either measure of arrears. This important finding is discussed further below. The long-run effects24 on the possessions rate are shown in Figure 7 for the debt-service ratio, estimated proportion in negative equity and the unemployment rate. Figure 8 shows the longrun impact of loan quality and forbearance policy, discussed further below. The figures suggest that in the first possessions crisis in 1989-93, the initial rise in possessions was driven mainly by the rise in the debt-service ratio, combined with lower loan quality, but later the rising incidence of negative equity emerged as an important driver. The persistence of negative equity prevented a faster decline in possessions, despite lower interest rates and the forbearance policy introduced at the end of 1991. In the second possessions crisis, the rise in possessions from its low level in 2004 again was caused by a growing debt-service ratio, and later the increasing incidence of negative equity, which rose sharply in 2008-9. To illustrate the magnitudes implied by this research, a 10 percent increase in the debt-service ratio, for example due to the mortgage interest rate rising from 4 percent to 4.4 percent, is estimated eventually to raise the possessions rate by around 19 percent, and the 6 month arrears rate, corrected for measurement bias, by 15 percent. This calculation holds the proportion of mortgages in negative equity and the unemployment rate fixed. At 2009Q3 house price and debt levels, a fall in house prices of 1.4 percent would raise the proportion of mortgages with negative equity from an estimated 8.5 percent to 9.35 percent, a 10 percent proportionate increase. An increase of this magnitude in the rate of negative equity is estimated eventually to increase the possessions rate by 7 percent and the 6 month arrears rate by 3.5 percent. A ten percent increase in the unemployment rate from 8 percent to 8.8 percent is estimated to increase the possessions rate by 2 percent32 and the 6 month arrears rate by 10 percent. The sustainability of these relatively benign conditions is questionable, however, given the 31 In late 2009 the spread between mortgage rates on new loans and base rate was close to 350 basis points, with base rates at 0.5%. It seems likely that the spread would narrow with base rates at 1.5 or 2 %. Also with slightly higher base rates and hence higher deposit rates, retail saving flows into banks are likely to improve, perhaps easing credit constraints on lending. 32 This estimate is less accurate than the others and the figure could well be as high as 4 percent. 32 funding gap between retail deposits in UK banks and their loan book33, the time-table of withdrawal of the Special Liquidity Scheme and the Credit Guarantee Scheme, and concerns over the UK‟s sovereign debt.?, see Exploration of claimed link between Deposits and Bank Lending, in Werner Quantity Theory of Credit.???? ( otherwise this seems a very good paper!!! Two UK government objectives are to improve housing affordability and to restore financial stability. Housing has become unaffordable for many younger people, perpetuating the inequality from the redistribution of housing wealth of the late 1990s to 2007, from potential first-time buyers to older and wealthier households. However, substantial falls in house prices, triggered by the removal of income support, higher interest rates and potentially by supply and demand side reforms34 , could increase negative equity and exacerbate the problem of bad banking loans. It would, however, be a mistake to take the risk of substantial falls in house prices as an excuse for not expanding residential land supply. For if reforms of the planning system and of incentives for local governments to expand the supply of residential building land were to increase the rate of future building, DCLG‟s housing affordability model and research done for the Barker review suggests that the effects on house prices would be felt only gradually. A further advantage in the short-run would be employment gains in the building industry at a time when the public sector will be shedding jobs. In the long-run, a more sustainable level of house prices relative to the financial capabilities of households should reduce the risk of new crises.https://www.ftadviser.com/mortgages/2019/09/11/high-ltv-mortgages-spike-to-2008-level/ ![]() BoE data showed mortgages with LTVs higher than 90 per cent accounted for nearly 11 per cent of the market in the second quarter of 2007, but that had dropped to 2 per cent in the same quarter of 2009. Between 2009 and 2014, the share of high LTV mortgages spiked above 2 per cent in only three quarters but has gradually increased over the past five years.December 2020 The share of mortgages advanced in 2020 Q3 with loan to value (LTV) ratios exceeding 90% was 3.5%, 2.4pp lower than a year earlier (Chart 3). Back to December 2019, ( A year is a long time in Confidence Land.) Dan White, director at Champion Hall & White, thought the mortgage price war was partly responsible for the increase in high LTV products. He said: “Customers will opt for 90 and 95 per cent mortgages more partly because the rates have come down so much. “I think lenders are more willing to lend at the level, too, although it’s more strict than it was in 2007. A consumer’s affordability and credit score have to be strong to get a 95 per cent mortgage.” Mr White added that lending at 95 per cent LTV was acceptable as long as lenders looked after their borrowers and were willing to offer their customers new deals, rather than expensive retention rates. But Sarah Drakard, independent financial adviser at Cruze Financial Solutions, said the high share of high LTV mortgages was “worrying” because the property market was “just not strong enough” to deal with the risks. She added: “People forget about the financial crash. A few years ago, my first-time buyer clients didn’t want to buy a property with small deposits as they thought it wasn’t the ‘safe’ thing to do. “But now people are perhaps struggling to save, or parents are less willing to give money in unpredictable political times, so less people are able to save for big deposits.” ![]() ![]() ![]() ![]() Residential property price indices for Tokyohttps://www.researchgate.net/publication/276083416_Residential_property_price_indices_for_Tokyo Residential Property Price Indexes for TokyoErwin Diewert and Chihiro Shimizu1 Revised April 28, 2014Discussion Paper 13-07, School of Economics,The University of British Columbia,Vancouver, Canada, V6T 1Z1. Abstract The paper uses hedonic regression techniques in order to decompose the price of a house into land and structure components using real estate sales data for Tokyo. In order to get sensible results, a nonlinear regression model using data that covered multiple time periods was used. Collinearity between the amount of land and structure in each residential property leads to inaccurate estimates for the land and structure value of a property. This collinearity problem was solved by using exogenous information on the rate of growth of construction costs in Tokyo in order to get useful constant quality subindexes for the price of land and structures separately. The paper also shows how flexible depreciation schedules for houses can be obtained using sales data.Key WordsHouse price indexes, land and structure components, time dummy hedonic regressions, spline functions, flexible functional forms, Fisher ideal indexes, flexible depreciation rates. Walter Erwin Diewert 37.83University of British Columbia - Vancouver Chihiro Shimizu 20.94The University of Tokyo How to Better Measure Hedonic Residential Property Price IndexesAuthor(s):Mick SilverPublished Date:November 2016 I. Introduction A. The problems Macroeconomists and central banks need measures of residential property price inflation. They need to identify bubbles, the factors that drive them, instruments that contain them, and analyze their relation to recessions.2 Such measures are also needed for the System of National Accounts and may be needed as part of the measurement of owner-occupied housing in a consumer price index—see Eurostat et al. (2013, chapter 3). Timely, comparable, proper measurement is a prerequisite for all of this, driven by concomitant data. ![]() ![]() ![]() ![]() ![]() ![]() ![]() ![]()
![]() ![]() ![]() https://publications.parliament.uk/pa/cm201011/cmselect/cmtreasy/memo/taxpolicy/m32.htm https://www.in2013dollars.com/uk/inflation/1751?amount=100 ![]() ![]() ![]() Our empirical findings reject the canonical view that interest rates somehow affect economic growth, and in an inverse manner. To the contrary, long-term and short-term interest rates follow the trend of nominal GDP, in the same direction, in all countries examined. This suggests that markets are not in equilibrium and the third factor driving GDP growth is a quantity – as shown by Werner, 1997, Werner, 2012a in the case of Japan (namely, the quantity of bank credit creation for the real economy - i.e., for GDP transactions, as the Quantity Theory of Credit postulates; Werner, 2013a). Herman Daly wrote in 1991: “Environmental economics, as it is taught in universities and practiced in government agencies and development banks, is overwhelmingly microeconomics. The theoretical focus is on prices, and the big issue is how to internalize external environmental costs so as to arrive at prices that reflect full social marginal opportunity costs. Once prices are right, the environmental problem is ‘solved’” (Daly, 1991, 255).https://www.finder.com/uk/mortgage-statistics ![]() ![]() ![]() ![]() ![]() ![]() ![]() ![]() ![]() ![]() ![]() ![]() ![]() ![]() https://www.sciencedirect.com/science/article/pii/S1057521915001477 ![]() ![]()
http://userpage.fu-berlin.de/~roehrigw/creutz/geldsyndrom/english/index.html ![]() ![]() ![]() ![]() ![]() ![]() ![]() ![]() ![]() ![]() ![]() ![]() ![]() ![]() https://www.bankofengland.co.uk/-/media/boe/files/quarterly-bulletin/2014/money-creation-in-the-modern-economy.pdf ![]() — RealRLD (@rld_real_CPR) December 10, 2020I wrote this following bit in 2011. Some people say a crash in house prices is necessary as a Valuer that has valued Oil refineries and Gas Terminals in another life I have one comment on that. There is a way of calculating the base market price on a real asset such as property the logical lower end price or entry price for property is not zero just as the maximum price must be related in some way to income multiples. ( my final year thesis for my degree was the Contractors Principle of Valuation for Taxation of Gas Terminals in Scotland, I had been employed by one of the Seven sisters. ) My very simple contention is that the basic price of a property in a market where there is no longer any activity.In a crashed or stagnant market supply and demand does not provide a Market price of comparable transactions in this situation the economic replacement cost of the property needs to be refrenced. This is a fairly easy thing to calculate there is a thing called Spons an almanac of prices/costs for the contracting world) that gives average building materials and labour costs for building. Today I would say £150 persqft would be a sensible price per square foot for a fairly traditional british house build there are cheaper ways and better ways to build but this is a first principles 101. The price of any property has a land element generally this is around 1/3rd of the total price any amount of sophisticated analysis will get you a variation around this figure and so on but the humble 1/3rd 1/3rd 1/3rd usually brings home the bacon so I’ll use it here so that then is £150 psft for the land element. Finally there is the last 1/3rd which is for the unknowns opportunity cost and profit. If we want to take the profit out again the maths to do that is easy but I’ll leave it as a 1/3rd for now. Right that gives a base cost pers sqft of £450 per sqft. For a more basic budget build one could argue for £100 per sq ft giving £300 pers sqft . Anyway if we say take £275 psf which is very low and in all probability below the actual economic replacement cost if you take a 750 sqft 2 bedroom apartment that would be a bottom line economic replacement cost value of £206,250. Regardless of anything people need somewhere to live in the future and an economic value has to be placed on production my question is this what policies going forward an banking system will support the proposition that every family should at least have a 2 bedroom family home and the cost of providing it would be roughly the figure I am suggesting if one factors in the opportunity cost for instance the government has lots of land it could contribute for free but its value still has to be recognised even if not charged for. These are open Market prices and assumptions but provision of housing has to be priced some way and I do plan to get into some analysis of the Affordable so called social housing side fo the equation as I say this is a first principles starting 101. I am going to develop this hypothesis further but just wanted to get it on paper going forward from this blog, in a melt down of the banking system and complete crash of the UK property market these first principles of economic replacement cost will be necessary to avoid a huge potential scam.And Here we are now in December 2020 9 and a half years later. I have indeed been developing this Hypothesis further. Moduloft Finance Affordable Finance A Framework of Understanding (First Draft Still Proof Reading) ![]() #JollySwagMan #housingbubbleweek Series @jollyswagmanpod and #Moduloft #COP26 What do you know about Money Anyhow #ConquestofDough #GrubStreetJournal , #Bitcoin #Mooning Bare arsed wash trading. @wiki_ballot @Pathos14658352 @GrubStreetJorno @financialeyes @JoeBlob20 @scientificecon @jbhearn![]()
Housing Market Fundamentals including Debt. From Shiller’s Irrational Exuberance to The Covid19 Debt Bomb.#COP26 Moduloft Primer.
FUll Blog reposted from Grub Street Journal https://notthegrubstreetjournal.com/2020/12/01/towards-a-home-owning-democracy-modulof-on-money-series-indexed-units-of-account-cop26/
Towards a Home Owning Democracy. #Moduloft on Money Series #Indexed Units of Account #COP26 #ConquestofDough
FUD Edition Grub Street Journal
![]() ![]() ![]() ![]() ![]() ![]() ![]() ![]() ![]() |
Roger G LewisMarket Commentary and shooting the breeze. Archives
December 2020
|