Real Estate Land Development (RLD) Limited
  • Home@ix Home Page
  • Land Requirements
  • Real Estate Land and Developments Limited
  • Contact
  • Blog
Picture

The At The risk of Re-Iterating Myself Blog.

Mortgage Market Heavy Breaking Applied.

1/31/2023

0 Comments

 
https://twitter.com/RealEstateLand3/status/1620362281300414465

https://t.co/t9hhjWG8np

— Real-Estate Land Development Limited (@RealEstateLand3) January 31, 2023
https://twitter.com/RealEstateLand3/status/1538517664615768065 https://twitter.com/RealEstateLand3/status/1620362954335223808

@homeatix @scientificecon @ianmulheirn @DrCameronMurray @jbhearn @financialeyes @scientificecon @bankofengland Batton Down the Hatches, #incoming #GoingDirect pic.twitter.com/LHOO4KMPAV

— Real-Estate Land Development Limited (@RealEstateLand3) January 31, 2023
https://twitter.com/RealEstateLand3/status/1620364323385389056

https://t.co/lxynxoJ5Qp #GoingDirectMindmap pic.twitter.com/q81vnez0eU

— Real-Estate Land Development Limited (@RealEstateLand3) January 31, 2023
https://twitter.com/RealEstateLand3/status/1620365702610972672

@homeatix @scientificecon @ianmulheirn@DrCameronMurray @jbhearn @financialeyes @scientificecon @bankofengland #GoingDirect #Incoming https://t.co/OmWHRzFMzY @dishonestmoney @Carlier_J87 https://t.co/kcgbtfiTI3 pic.twitter.com/8Q13uYCKOa

— Real-Estate Land Development Limited (@RealEstateLand3) January 31, 2023
   
0 Comments

Supply Side Jesus and the Housing Crisis.

1/19/2023

0 Comments


https://t.co/r1z0cr6mzy pic.twitter.com/6ICZNqLR6G

— Jeff Stein (@JStein_WaPo) January 18, 2023

'Housing Crisis' #Monoplisation #Rentierisation and #Financialisation. "The Housing Crisis", a feature of neo-liberal political economy, not a bug. #SupplySideJesus @homeatix https://t.co/w3iYmOvgFB

— Real-Estate Land Development Limited (@RealEstateLand3) January 19, 2023

'Housing Crisis' #Monoplisation #Rentierisation and #Financialisation. "The Housing Crisis", a feature of neo-liberal political economy, not a bug. #SupplySideJesus @homeatix https://t.co/ZwKwNafPfV

— Real-Estate Land Development Limited (@RealEstateLand3) January 19, 2023
0 Comments

Chatgpt, AI and the Affordable Housing Crisis

1/17/2023

0 Comments


Chatgpt, AI and the Affordable Housing Crisis

[caption id="attachment_29021" align="aligncenter" width="300"] https://openai.com/blog/chatgpt/[/caption]

Affordable Housing Crisis solutions ?

There are several potential solutions to the affordable housing crisis, including:
  1. Increasing government funding for affordable housing development and preservation. This can include funding for the construction of new affordable housing units, as well as programs to preserve existing affordable housing.
  2. Implementing inclusionary zoning policies. These policies require developers to include a certain percentage of affordable housing units in new developments.
  3. Rent control and stabilization. Rent control laws limit the amount that landlords can charge for rent, while rent stabilization programs help to keep rent increases in check.
  4. Increasing access to housing vouchers and other forms of rental assistance. These programs help low-income renters afford market-rate housing.
  5. Building more tiny homes and accessory dwelling units. Building small, affordable housing units can help to increase the supply of affordable housing and make it more accessible for low-income renters.
  6. Increasing support for community land trusts and other forms of community ownership. This can help to ensure that affordable housing remains affordable in the long term.
  7. Encouraging mixed-income developments. These developments mix affordable housing units with market-rate units, helping to create more diverse and inclusive communities.
  8. Reducing barriers to housing development, such as zoning regulations and land-use restrictions.
  9. Encouraging and supporting innovative solutions like modular and prefabricated housing, which can speed up the construction process and make housing more affordable.
  10. Encouraging and supporting the use of technology to improve the efficiency and effectiveness of the housing market, such as online platforms for finding and applying for affordable housing.

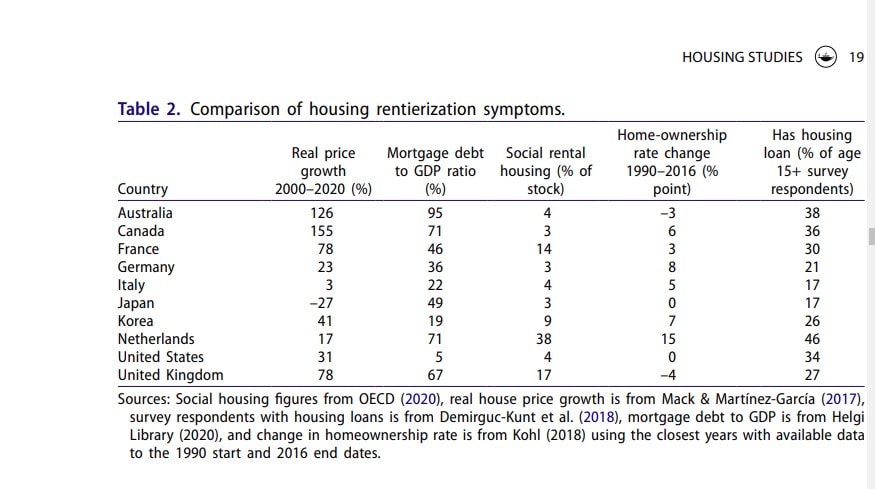
Home ownership rates and Affordable Homes, The Housing Ladder?

Homeownership rates refer to the percentage of households that own their own homes, as opposed to renting. The housing ladder is a term used to describe the process of moving up from renting to homeownership. Homeownership rates have traditionally been seen as a measure of economic stability and upward mobility, as owning a home is often considered a key step on the "housing ladder." However, homeownership can also be a source of financial stress, particularly for low-income households. The affordability of homes is a key factor in determining homeownership rates, as many low-income households are unable to afford to purchase a home. The lack of affordable homes can make it difficult for households to move up the housing ladder, as they may not be able to afford to purchase a home even after saving for a down payment. In recent years, the affordable housing crisis has led to a decrease in homeownership rates, particularly among low-income households. This is due to a number of factors, including rising housing costs, stagnant wages, and a lack of affordable housing options. To address the affordable housing crisis, there are a number of policy solutions that can be implemented to increase the supply of affordable homes and improve access to homeownership for low-income households. These include increasing funding for affordable housing development, implementing inclusionary zoning policies, and reducing barriers to housing development. Additionally, providing financial assistance and education to help low-income households purchase homes, can help to improve the housing ladder.

Absorption rates for new home development and Rentierisation and Financialisation of the Finance and Housebuiding sectors?

Absorption rate for new home development refers to the rate at which new homes are sold or rented. It is calculated by dividing the number of new homes sold or rented in a given period by the total number of new homes available during that period. A high absorption rate indicates that there is a strong demand for new homes, while a low absorption rate suggests that there is an oversupply of new homes on the market. The Rentierisation and Financialisation of the finance and housebuilding sectors refers to the increasing trend of large financial institutions and real estate companies becoming involved in the housing market. This trend has led to the commodification of housing, with homes becoming increasingly viewed as financial assets to be bought and sold for profit rather than places to live. This trend has led to a number of negative consequences, including the displacement of residents and the exacerbation of the affordable housing crisis. Additionally, when the housing market becomes dominated by financial institutions and real estate companies, the development and management of housing is often driven by financial considerations rather than social and community needs. To address the negative effects of the rentierisation and financialisation of the housing market, policymakers can implement a number of measures, including increasing regulation of the real estate market, providing incentives for the development of affordable housing, and encouraging community ownership of housing. Additionally, promoting financial education and regulations to make sure that it is not just a way of speculation but a way of encouraging citizens to have a sustainable future.

Big Bang and Liberalisation and the effect of neo liberal ideology on supply side measures rather than systemic fiscal and monetary demand side policies

The Big Bang refers to a series of financial market deregulation measures that were implemented in the UK in 1986. These measures, which included the deregulation of stockbroker commissions and the removal of fixed commissions for securities trading, aimed to increase competition and efficiency in the financial markets. Liberalization is a term used to describe the process of removing government regulations and restrictions on economic activity. Neo-liberal ideology is a political and economic philosophy that emphasizes free markets and minimal government intervention in the economy. The effect of neo-liberal ideology on the housing market has been to focus on supply-side measures, such as deregulation and privatization, rather than on systemic fiscal and monetary demand-side policies. This has led to an emphasis on increasing the supply of housing through private sector development, rather than on addressing the underlying demand for affordable housing through policies such as rent control, public housing construction, and subsidies. The adoption of neo-liberal policies has led to a decline in the availability and affordability of housing for low-income households, and has contributed to the financialization of housing. There has been a growing criticism of this ideology, arguing that it has led to the creation of a housing market that prioritizes the interests of developers and investors over those of renters and buyers, and that it has failed to address the underlying issues causing the housing crisis. To address the negative effects of neo-liberal policies on the housing market, some experts suggest a shift towards demand-side policies, such as increasing subsidies for low-income renters and implementing policies to increase access to affordable housing, as well as addressing the systemic issues such as lack of affordable financing and lack of regulations on the financial sector that is driving the financialization of housing.

Which lobbyist and think tank groups influence the narrative around The Housing Crisis in the US , The UK and the other G7 and G20 Countries.

In the United States, the housing crisis narrative is influenced by a variety of different lobbyist and think tank groups, including:
  1. The National Association of Realtors (NAR) is one of the most powerful lobby groups in the US, representing real estate agents and brokers. NAR has a significant influence on housing policy and often advocates for policies that benefit the real estate industry.
  2. The National Multi Housing Council (NMHC) represents the interests of large apartment building owners and developers. They often advocate for policies that would benefit the rental housing industry and make it more profitable.
  3. The National Low Income Housing Coalition (NLIHC) is a non-profit organization that advocates for affordable housing for low-income households. They often push for policies such as increasing funding for affordable housing construction and preserving existing affordable housing.
  4. The American Enterprise Institute (AEI) is a conservative think tank that often promotes free-market solutions for housing issues and argues against government intervention in housing markets.
In the United Kingdom, the housing crisis narrative is influenced by a similar set of groups. These include the National Landlords Association (NLA), the Home Builders Federation (HBF) and the Royal Institution of Chartered Surveyors (RICS) which represent the interests of landlords, house builders and property professionals respectively, and think tanks such as the Adam Smith Institute (ASI) and the Centre for Policy Studies (CPS) which promote free-market solutions to housing issues. In other G7 and G20 countries, the narrative around the housing crisis is also influenced by various lobby groups and think tanks. For example, in Canada, the Canadian Real Estate Association (CREA) and the Canadian Home Builders Association (CHBA) represent the interests of real estate agents and home builders, respectively, and in Australia, the Housing Industry Association (HIA) represents the interests of the housing construction industry. It's worth noting that there are also groups and organizations that are pushing for progressive solutions to the housing crisis and advocating for affordable housing for low-income households, such as non-profits and advocacy groups.
 

What is the relative importance of Household wealth and Financial Wealth to the collateralisation of Commercial Bank balance sheets and central banks Balance sheets. To what extent does Mortgage lending effect M3 and M4 monetary measures?

Household wealth and financial wealth are both important factors in the collateralization of commercial bank balance sheets and central bank balance sheets. Commercial banks use the assets of their customers, including both household wealth and financial wealth, as collateral for loans and other financial products. This collateral helps to provide security to the bank and its customers, and reduces the risk of default on loans. Mortgage lending, in particular, can have a significant effect on M3 and M4 monetary measures. M3 and M4 are measures of the money supply that include a broader range of assets than traditional measures such as M1 and M2. M3 includes M2 plus long-term time deposits and institutional money market funds, and M4 includes M3 plus other deposits held by non-financial corporations. Mortgage lending can impact M3 and M4 measures by increasing the amount of money in circulation. When a bank makes a mortgage loan, it creates new money by crediting the borrower's account. This new money can then be used to purchase goods and services, which in turn can boost economic growth. Additionally, mortgages are often securitized and sold to investors, which in turn can create new financial products and increase the financial wealth. However, it's worth noting that excessive mortgage lending, particularly risky or subprime mortgages, can also increase the risk of defaults and financial instability. This is why, Central Banks and regulatory authorities closely monitor the mortgage market and have put in place regulations to mitigate these risks. In summary, both household wealth and financial wealth are important factors in the collateralization of commercial bank balance sheets and central bank balance sheets, and mortgage lending can have a significant effect on monetary measures such as M3 and M4. However, it's important to keep an eye on the mortgage market to mitigate risks associated with mortgage lending.

What were the detrimental aspects of de mutualisation of Building Societies in the UK .

The de-mutualization of building societies in the UK refers to the process of converting building societies, which are mutual organizations owned by their members, into publicly traded companies. This process began in the late 1980s and continued into the 1990s. There were several detrimental aspects of de-mutualization of building societies in the UK:
  1. Loss of member control: Building societies were traditionally controlled by their members, who were able to participate in decision-making through the election of board members and the approval of major decisions. When building societies were de-mutualized, control was transferred to shareholders, who may not have had the same interests as the members.
  2. Short-term focus: Publicly traded companies are often under pressure to deliver short-term financial results to shareholders. This can lead to a focus on short-term profits at the expense of long-term stability and sustainability.
  3. Risk-taking: De-mutualized building societies were able to access more capital, which can increase the level of risk-taking. Some de-mutualized building societies got involved in high-risk activities such as derivative trading, which led to significant losses.
  4. Reduced lending to low-income borrowers: Building societies had traditionally been a source of mortgages for low-income borrowers, but many de-mutualized building societies reduced their lending to this group as they focused on more profitable customers.
  5. Loss of community ties: Building societies were often deeply embedded in local communities and were seen as a trusted institution. The de-mutualization process led to the loss of these community ties, which can have a detrimental impact on the local economy.
  6. Distribution of windfall gains: The conversion of building societies into plc's resulted in the distribution of windfall gains to members, rather than the reinvestment of these funds into the society for the benefit of all members.
Overall, the process of de-mutualization of building societies in the UK has been criticized for leading to a loss of member control, a short-term focus, increased risk-taking, reduced lending to low-income borrowers, and the loss of community ties.

Are central bank digital currencies , vaccination passports and social points systems within the policy objectives of the United Nations sustainability goals.

Central bank digital currencies (CBDCs), vaccination passports, and social points systems can be seen as having potential implications for the United Nations' sustainability goals. CBDCs, which are digital versions of fiat currencies issued and backed by central banks, can have the potential to increase financial inclusion and accessibility, especially for those who are unbanked or underbanked. This aligns with the United Nations' goal of providing universal access to financial services and reducing poverty. Vaccination passports, which are digital certificates that confirm an individual has been vaccinated, can help to ensure that people are able to travel safely and resume their lives, which aligns with the United Nations' goal of ensuring healthy lives and well-being for all. Social points systems, which are digital systems that assign points to individuals based on their behavior, can be seen as having potential implications for the United Nations' goal of promoting sustainable consumption and production patterns. These systems can incentivize individuals to engage in sustainable behaviors, such as recycling or using public transportation, by rewarding them with points or other benefits. However, it's worth noting that there are also potential downsides and risks associated with these technologies. For example, there is a risk of exclusion, discrimination and privacy concerns related to these systems and they may not be inclusive to all segments of the population. Therefore, it's important to carefully consider and address these risks when implementing these technologies. In summary, central bank digital currencies, vaccination passports, and social points systems can have the potential to align with some of the United Nations' sustainability goals, but their implementation must be done in a way that takes into account potential downsides and risks, and that is inclusive and addresses the social and economic inequalities.

How influential have UN land value capture policies been as measured by local planning policies adopted at Country (National Planning Policy Framework ) and city mayoral levels. ( London GLA ) for example.

The United Nations (UN) has recognized the importance of land value capture policies as a means of financing sustainable development and addressing social and economic inequalities. However, the influence of these policies at the local level, such as country (National Planning Policy Framework) and city mayoral levels, varies depending on the country and the political context. For example, in the United Kingdom, the National Planning Policy Framework (NPPF) has been influential in shaping local planning policies, but the specific policies related to land value capture have not been given a significant emphasis. The NPPF includes policies related to the capture of land value uplift resulting from public investment, such as the Community Infrastructure Levy (CIL), which is a charge on new development used to help fund infrastructure. However, the CIL has been criticized for not being effective enough in capturing land value uplift, and it's not widely adopted by local authorities. In London, the Greater London Authority (GLA) has been more proactive in implementing land value capture policies, through the London Infrastructure Plan 2050, which includes a range of policies to capture land value uplift, such as the London CIL, the Mayoral Community Infrastructure Levy, and the Mayoral Development Corporation. These policies aim to fund the development of infrastructure, such as housing and transport, and to fund the regeneration of deprived areas. The GLA also has a planning policy on viability, which is designed to ensure that developers contribute a fair and reasonable share of their profits to the provision of affordable housing and other community benefits. Overall, the influence of UN land value capture policies can be measured by the extent to which they have been adopted and implemented at the local level, but it's important to note that the adoption and implementation of these policies is often influenced by a range of factors, such as the political context, the availability of funding, and the capacity of local authorities to implement them.

If the Theory of aggregated Credit (Werner) is applied to the Affordable Housing crisis, which policy measure would have been more successful in tackling housing inequality, and wealth inequalites. What proportion of the UK and US populations are net receivers of Interest and have a positive networth with Financial as well as residential property wealth.

The theory of aggregated credit, proposed by Richard Werner, suggests that credit creation by banks plays a crucial role in economic development and that the availability of credit is the main determinant of economic growth. According to this theory, increasing the availability of credit to low-income households and communities can help to address housing inequality and wealth inequality. If this theory were applied to the affordable housing crisis, one policy measure that would have been more successful in tackling housing inequality and wealth inequalities would be to increase the availability of credit to low-income households and communities. This could be done through a variety of measures, such as:
  1. Increasing access to affordable mortgages: By making it easier for low-income households to obtain mortgages, more people would be able to afford to buy a home.
  2. Increasing access to affordable rental housing: By making it easier for low-income households to obtain rental housing, more people would be able to afford to rent a home.
  3. Increasing access to affordable home improvement loans: By making it easier for low-income households to obtain loans for home improvement, more people would be able to improve their homes, which could help to address housing inequality.
According to the most recent data available, in the UK, the proportion of the population that is a net receiver of interest, with a positive net worth with financial as well as residential property wealth, is around 20-25%. In the US, the proportion is slightly higher around 40-50%. However, It's worth noting that these figures are estimated and may vary depending on the data source and the time period.

Soft bank have invested in two high profile corporate failures, Greensill Capital and Katerra to what extent are supply chain finance and monopoly last man standing business models related to a trend towards Monopoly rentier capitalism?

Supply chain finance and monopoly last man standing business models have been linked to a trend towards monopoly rentier capitalism. Supply chain finance is a type of financing that allows companies to borrow money using their accounts receivable, such as invoices from their suppliers, as collateral. This type of financing can create a concentration of power among a small number of large companies, as they are able to use their scale and market power to access financing on favorable terms. This can lead to the suppression of competition and result in a situation where a few large companies are able to extract monopoly rents, or excess profits, from the market. Monopoly last man standing business models, often referred to as winner-takes-all or network effects, refer to a situation where a single company or a small group of companies are able to dominate a market by virtue of their size and market power, which allows them to extract monopoly rents from the market. This can happen when a company's product or service becomes so popular and widely used that it becomes difficult for other companies to compete, creating a barrier to entry. SoftBank's investments in Greensill Capital and Katerra, both of which have recently experienced high-profile failures, can be seen as an example of this trend towards monopoly rentier capitalism. Both Greensill Capital and Katerra were involved in supply chain finance and had aspirations to become dominant players in their respective markets, but ultimately failed to do so due to a combination of factors including fraud and mismanagement. This highlights the

elaborate on fraud and mismanagement allegations in the Greensill and Katerra examples.

Greensill Capital was a UK-based supply chain finance company that collapsed in March 2021. The company had been facing financial difficulties due to the COVID-19 pandemic and the withdrawal of support from one of its main investors, SoftBank. After the collapse, it was revealed that the company had been engaged in fraudulent activities, such as misstating its financials, and had been providing loans to companies with poor credit ratings. The Financial Conduct Authority (FCA) and the UK's Insolvency Service have both launched investigations into Greensill's activities. There are also allegations that the company's founder and former CEO, Lex Greensill, had close ties with the UK government, which led to him gaining access to sensitive information and providing loans to companies with poor credit ratings. Katerra is a US-based company that designs, manufactures and builds structures such as homes and offices, it was founded in 2015 and raised more than $1 billion in venture capital. The company was also backed by SoftBank but had to file for bankruptcy in April 2021. The company faced a number of issues, including cost overruns, delays, and defects in its projects, as well as allegations of mismanagement and financial impropriety. It was reported that Katerra had a "frantic" culture where projects were pursued without proper

What is the Uber business model what would uberisation of the Private Rental Sector and For profit soical housing sector look like . Blackrocks investment in Single Family homes in the US and their residential investment arms along wth Llyods bank seeem to be coincidental with a regulatory landscape which creates higher barriers for smaller scale landlords. Is there evidence for this.

The Uber business model is based on the use of a mobile app to connect customers with drivers who provide transportation services. The company operates as a platform that connects drivers and riders, and it makes money by taking a commission on each ride. The "Uberization" of the private rental sector and for-profit social housing sector would involve the use of a similar platform-based model to connect landlords and renters. This could involve the use of a mobile app or website that allows renters to search for and book rental properties, and landlords to list and manage their properties. The platform would make money by taking a commission on each rental transaction. BlackRock's investment in single-family homes in the US and their residential investment arms, along with Lloyds bank, seem to be coincidental with a regulatory landscape which creates higher barriers for smaller scale landlords. These institutions have been buying up large portfolios of single-family homes, which can be rented out to individual tenants. This trend is known as institutionalization of the rental housing market, which is characterized by large-scale real estate investors buying up large numbers of homes and renting them out, often through property management companies. There is evidence that this trend is having an impact on the rental market, as smaller landlords are facing increased competition from these institutional investors, who can offer more favorable terms and better services. Some experts argue that this could lead to a reduction in the availability of rental housing for low-income households, as these institutional investors tend to focus on higher-income renters. However, others argue that this trend could lead to increased efficiency and stability in the rental market, as these institutional investors have the resources and expertise to manage large numbers of properties.

what are the major trends in housing tenure and domestic debt over the past 40 years in the UK and the US

Over the past 40 years, there have been several major trends in housing tenure and domestic debt in both the UK and the US:
  1. Increasing homeownership: In both the UK and the US, homeownership rates have been on the rise over the past 40 years. This has been driven by a combination of factors, including low interest rates, government policies to promote homeownership, and changes in societal attitudes towards homeownership.
  2. Increasing levels of mortgage debt: Along with the increase in homeownership, there has also been an increase in the levels of mortgage debt in both the UK and the US. This is due to the fact that more people are buying homes, and they are borrowing more money to do so.
  3. Increasing rental prices: In the UK and the US, rental prices have been increasing over the past 40 years, driven by a combination of factors including a growing population, a lack of new housing construction, and an increase in demand for rental properties.
  4. Increasing levels of household debt: In both the UK and the US, levels of household debt have been rising over the past 40 years, driven by a combination of factors such as low interest rates, easy access to credit, and changes in societal attitudes towards debt.
  5. Increasing inequality in housing tenure: In both the UK and the US, there has been an increase in inequality in housing tenure over the past 40 years, with a growing number of households becoming trapped in the rental market and unable to afford to buy a home, while others are able to accumulate significant levels of housing wealth.
  6. Increasing vulnerability of renters: Both in the UK and the US, renters have become increasingly vulnerable to evictions and displacement, with rising rents, the lack of affordable housing and the COVID-19 pandemic exacerbating this trend.
Overall, these trends have led to a more complex and challenging housing market in both the UK and the US, with a growing number of households facing difficulties in securing affordable and stable housing, increasing levels of debt and increasing inequality.

Generation Debt, Generation Rent and Gen Z , what hope is there of redressing the Grip of an Oligarchical Financial Rentier Class upon policy formulation which honours democratic ideals of one person one vote rather than one dollar one vote? Will the Anti Monopoly Georgist principles of the Landlords Game be played or the Monopoly rules of Darrows Board Game continue the new Gilded Age.

The terms "Generation Debt," "Generation Rent," and "Gen Z" refer to different groups of people who are facing different challenges in the housing market. Generation Debt refers to the generation of people who have taken on a significant amount of debt, often in the form of mortgages, in order to buy a home. Generation Rent refers to the generation of people who are unable to afford to buy a home and are instead renting. Gen Z is the youngest generation that is entering the housing market and facing similar challenges as the previous generations. The hope of redressing the grip of an oligarchical financial rentier class upon policy formulation that honors democratic ideals of one person one vote rather than one dollar one vote is a complex issue and there's no single solution that can address it. However, some possible solutions that have been proposed include:
  1. Implementing policies that promote affordable housing: Such as rent control, inclusionary zoning, and social housing.
  2. Tax reform to reduce the concentration of wealth and power: Such as progressive taxation and wealth taxes, which would help to redistribute wealth and reduce the gap between the rich and the poor.
  3. Land value taxation: The Georgist principle that states that the value of land should be taxed rather than the structures built on it, would increase the affordability of housing and reduce the concentration of wealth.
  4. Increasing access to credit: By making it easier for low-income households to obtain mortgages, more people would be able to afford to buy a home, and this will also help to increase the supply of affordable rental housing.
  5. Regulating and restricting the activities of monopolies: By implementing regulations that restrict monopolies and promote competition, it would reduce the concentration of wealth and power, and increase the availability of affordable housing.
It's worth noting that these solutions require a combination of political will and public support to be implemented and sustained. The Anti-Monopoly Georgist principles of the Landlords Game may be played, but it's uncertain if it will be enough to change the current rules of Darrows Board Game, that continues the new Gilded Age.
 
0 Comments

Monoplisation , Rentierisation and Financialisation."The Housing Crisis", a feature of neo-liberal political economy, not a bug.The Evidence.

1/16/2023

0 Comments


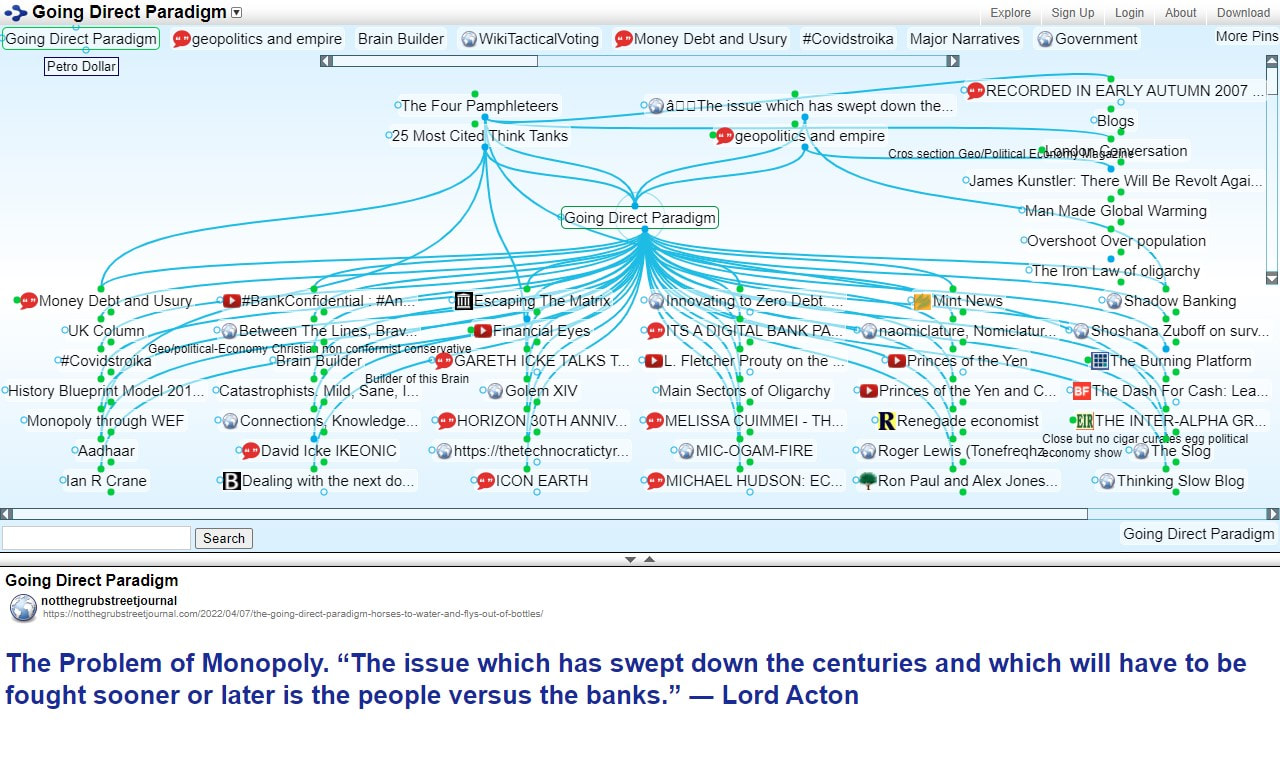
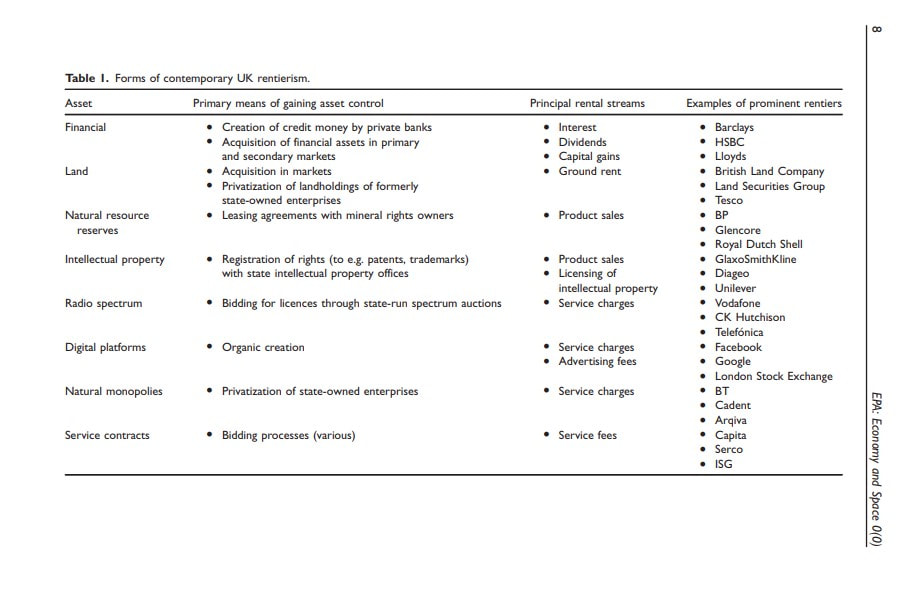
Monoplisation,Rentierisation and Financialisation.
"The Housing Crisis", a feature of neo-liberal political economy, not a bug.
The Evidence.

"As austerity is an ideological political choice and not a compulsion so it is with the "Housing Crisis". We argue that in the pursuit of the goals of the Monopoly and Oligopolistic corporate sector, policy goals inevitably create the accelerated headlong rush to a polarised society of Haves and have not's demarcated by Homeowner ship for fewer and fewer and increased precarity for more and more of those in rental accommodation.
A wide-ranging discussion with Ranjan of London Conversation on the Home@ix re-patterned Knitting in response to the emerging Going Direct Paradigm. 
Each group has its own economic interests and perspective foremost when it analyses the economy and promotes a particular viewpoint. Politicians, economists, and business people rarely promote analysis that conflicts with their group interests. Clarity and analytical integrity generally work against private interests and are usually absent many apparently objective analyses.
In an attempt to seek out and further the public interest, even where this may conflict with the privileged private interests which usually dominate the analysis and debate in corporate discourse, we offer this frank discussion.
I would ask the easily shocked to consider that the uncompromising approach in This video will pose a major challenge to those who have learned their analysis exclusively through channels devoted to promoting privileged and usually private interests, and must “unlearn” erroneous but pervasive assumptions and principles, To understand what there may be in these discussions which provide a set of parts for a model to repair or replace an Old broken model.  obsolete.


https://webbrain.com/brainpage/brain/DF9DB595-A602-0BF0-DF0D-24BD4E25F6DF#-1 https://issuu.com/homeatix http://www.realrld.com/
Picture

​Benefits to Bricks , A Home@ix response to PM and Michael Gove . Proposing the; English, Scottish, Welsh, & Ulster Land pound .

https://t.co/vgERTax3PX

— Real-Estate Land Development Limited (@RealEstateLand3) January 16, 2023

#AbsorbtionRate Letwin #MissallocatedCredit Redfern #Monopoly #rentierisation #Fiscalisation @homeatix #HousingCrisis #feature of #neoliberalpoliticaleconomy #notabug @DrCameronMurray @ianmulheirn @financialeyes @scientificecon @GenRentBook @genrentuk https://t.co/omL6r3pMIe pic.twitter.com/B7R6QXm2Pf

— Real-Estate Land Development Limited (@RealEstateLand3) January 16, 2023
0 Comments

Rentierisation, Financialisation and Absorption Rates. Monopoly or The Landlords Game, (AntiMonopoly, Class Struggle)

1/15/2023

0 Comments

 
Picture
Picture
"The definition of rent used in the present article – income derived from the ownership, possession or control of scarce assets and under conditions of limited or no competition"
The rentierization of the United Kingdom economy
The Landlord's Game is a board game patented in 1904 by Elizabeth Magie as U.S. Patent 748,626. It is a realty and taxation game intended to educate users about Georgism. It is the inspiration for the 1935 board game Monopoly.[1]

 : for Piketty (2014: 422) rent is
‘remuneration for ownership of [an] asset, independent of any labor’;
for Sayer (2015: 44) it is
a payment extracted ‘by those who control an already existing asset, such as land or a building or equipment, that others lack but need or want, and who can therefore be charged for its use’;
and finally for Standing (2016: 2) it is
income generated ‘from ownership, possession or control of assets that are scarce or artificially made scarce’.


Picture
The set had rules for two different games, anti-monopolist and Monopolist. The anti-monopolist rules reward all players during wealth creation, whereas the monopolist rules incentivize forming monopolies and forcing opponents out of the game.[3] In the anti-monopolist or Single Tax version (later called "Prosperity"), the game is won when the player with the least money doubles their original stake.[2]
​ in this alternative framing is income defined not by the asset to which it represents a payment – land rents, financial rents and so forth – but instead by the quantum of market power enabling its derivation. It is the profit attainable specifically due to a dearth of market competition. Thus, if ‘normal’ levels of profit are those that can be realized in a competitive situation, rents are the ‘excess’ returns afforded by any departure from that idealized scenario, the abnormal profits occasioned by the capitalist power to monopolize a market
​ (Tollison, 1982).
Picture
When homes earn more than jobs:
​the rentierization of the Australian housing market by,
Josh Ryan-Collins & Cameron Murray
citation: Josh Ryan-Collins & Cameron Murray (2021): When homes earn more than jobs: the rentierization of the Australian housing market, Housing Studies, DOI: 10.1080/02673037.2021.2004091
:https://doi.org/10.1080/02673037.2021.2004091
.​Rents can also be generated from assets that are not naturally scarce via the creation of monopolistic controls (e.g. patents) or other competition-reducing interventions. In modern times the most valuable land use is residential housing. Housing is a composite good consisting of property rights to a location (the land) and the  structures built upon that land (the capital). With the spread of home ownership to the middle classes following World War II, land and land rents became less concentrated than in the times in which the classical economists were writing, when a limited number of land-owners controlled the majority of land. Yet land rents remain and have been growing rapidly in the last four decades. The huge increases in home prices relative to incomes in advanced economies in the post-ward period were mainly in the form of rising land values, accounting for around 80% of growth since the 1950s on average, with construction/replacement costs increasing only at the rate of inflation (Knoll et  al., 2017). Wealth accumulation since the 1970s in many capitalist economies has largely been driven by increases in property prices via capital gains, rather than increases in profits from the production of goods and services (Rognlie, 2014; Stiglitz, 2015). Across advanced economies, the return on housing (capital gains and rental yield) has averaged 7% (Jordà et  al., 2019). This is over twice as high as that on benchmark financial assets (government bonds/Treasury bills) and similar to equities, but with markedly less volatility, in particular since World War II (ibid). The term ‘safe as houses’ has some merit from an investment perspective.

​
​

"As asset proprietor and in putting the asset to commercial use, the rentier sweats monopoly from every pore"

Picture
​The principal policy supporting the value of financial assets since the financial crisis, pursued in the USA and continental Europe as well as the UK, has been the ‘unconventional’ monetary policy known as quantitative easing (QE), which in the UK’s case has seen the Bank of England purchase some £375 billion of financial assets (Bunn et al., 2018: 1). QE has had a strongly positive effect on the prices of such assets. Bunn et al. (2018: 8) estimate that, without the Bank’s intervention, real prices of LSE-listed equities would have been 25% lower in 2014 than they actually were. And this, needless to say, has disproportionately benefited those who actually hold financial assets, which is to say the UK’s financial-rentier class, comprising the wealthiest households – the top decile by household wealth realized an estimated average gain in pensions wealth of over £200,000 between 2007 and 2012–2014 purely as a result of monetary policy changes, versus an average household gain of less than £40,000 (Bunn et al., 2018: 26) – and, even more so, the country’s leading financial institutions. No wonder that in 2011, as the lay of the post-crisis policy landscape on both sides of the Atlantic became increasingly clear, Paul Krugman (2011) railed against policymakers ‘catering almost exclusively to the interests of rentiers – those who derive lots of income from assets, who lent large sums of money in the past, often unwisely, but are now being protected from loss at everyone else’s expense’. In the absence of fiscal stimulus or debt relief, Krugman claimed, the ‘only real beneficiaries’ of existing policies were ‘bankers and wealthy individuals’. And QE has not only benefited the UK’s financial rentiers. Land rents have also been fuelled, through comparable, policy-driven inflation in the value of land assets. The estimated value of UK land increased by an eye-watering 64% between 2008 and 2016, from approximately £3 trillion to approximately £5 trillion (ONS, 2017: 5). Nowhere was this inflation more visible – and problematic – than in the nation’s seemingly perennially overheated housing market. Bunn et al. (2018: 8) estimate that, without the Bank’s unconventional monetary policy intervention in response to the financial crisis, UK real house prices in 2014 would have been 22% lower than they actually were. Post-crisis monetary policy, in short, has served to bolster major portions of the asset wealth of a rentier class already advantaged by three decades of exceptionally accommodating neoliberalism.
Picture


A housing supply absorption rate equation Cameron

K. Murray∗
​January 3, 2023
Abstract
What is the optimal rate of new housing supply? We answer this question with a simple model of new housing supply where the choice variable is the rate of new housing lot sales. This model is informed by the cost-side assumptions of the static equilibrium model but allows for demand for home-buying to vary over time. It differs from static models of housing production equilibrium by assuming that landowners hold land assets that are sold in asset markets to create new supply. Landowners maximise the present value of their balance sheet by choosing a rate of new housing lot sales, accounting for the effect on asset price growth from their sales in a housing market of finite depth. The resulting absorption rate equation has radically different parameter effects compared to the popular static housing density model. Constraints on density, for example, increase the optimal rate of supply by reducing the return to delaying development. Interest rates, land value tax rates, and demand growth, positively relate to the optimal rate of supply. The policy lessons are (1) the relationship between demand growth and the optimal supply rate limits the ability for market supply to reduce prices, and (2) increasing the cost to delaying housing development is the primary way to increase the market rate of housing supply.
​ Keywords: Absorption rate, housing supply, planning regulations. JEL Codes: R31, R38, R52
The intuition here is that new housing lots are assets, and supplying (selling) them to the market is an asset swap of land for cash. It does not matter whether a dwelling structure is built by the seller or the buyer of the lot; an asset swap of cash for construction is immediately reversed upon sale of developed housing. In Australia, for example, almost all new dwellings are sold by private housing developers rather than retained, and the prevailing business model is a build-to-order method with sales driving production rates (Murray, 2020a,c) Because housing is an asset in a market with a finite trading depth, additional lot or house sales in a period of time will affect price growth, limiting the market rate of housing absorption (see ​Letwin (2018)). The rate of supply is increased until the marginal benefit from supplying at that rate now equals the marginal cost from selling at that rate later. The marginal benefit now comes from converting the housing lot asset to a cash asset and is the interest return on the lot sale price and property tax savings compared to retaining ownership. The marginal cost later comes from the effect of sales today on housing asset price growth, and hence on the value at which the later housing lots can be sold. In short, the development market will limit the rate of new housing supply independently of the optimal or allowable development density because new housing production responds to asset market conditions. Our model is motivated by the observed behaviour of housing developers. Murray (2020c) showed that landbanks held by developers are managed as assets, not inventories, and supplied in response to housing asset market conditions. For example, one housing developer in that study owned 56,000 apartment lots on appropriately zoned sites but planned to supply only 1,000-2,000 per year (a 28-56 year pipeline) (Lendlease, 2019). Letwin (2018) also found that the rate of sales per period that developers were willing to make was a limiting factor for overall housing supply. To explain this behaviour our approach differs from static equilibrium models of housing density such as the Alonso-Muth-Mills formulation.
1. Over two decades ago DiPasquale (1999) noted that Virtually every paper written on housing supply begins with some version of the same sentence: while there is an extensive literature on the demand for housing, far less has been written about housing supply. Although this statement is clearly true, at this point, there have actually been a considerable number of papers on housing supply. However, the empirical evidence on the supply of housing is far less convincing than that on the demand for housing. (p.9) Little has changed. Indeed, the cost-based approach to housing supply, such as used in Glaeser & Gyourko (2018), remains dominant despite being repeatedly discredited (Murray, 2020b; Somerville, 2005; O’Flaherty, 2003).
2. The academic debate surrounding the effect of planning changes on the rate of housing supply and prices remains hotly contested (Manville et al., 2020; Rodr´ıguez-Pose & Storper, 2020; Cowan, 2019; Monkkonen, 2019; Wiener, 2020; Manville, 2019; Wegmann, 2019). Despite this, the pop-culture position seems to be that planning has extremely large effects on housing affordability (see, for example, Cowan (2019) and Yglesias (2012)), and has resulted in many planning reform proposals (MHCLG, 2020; Wiener, 2020; Hansen, 2020).
3. As described in the studies of housing supply studies of Murray (2020c) and Letwin (2018). The absorption rate puzzle applies to any single subdivision and also across the set of feasible and allowable development sites in a region. 

​7. There is often confusion in the housing supply literature between the rental price of a dwelling and the capital value of a dwelling. A divergence between these prices cannot be attributed to supply-side effects; they must be due to asset-pricing factors, such as low interest rates or growth expectations.

I have been studying your, When homes earn more than jobs: the rentierization of the Australian housing market. Paper with Josh Ryan Collins . Listened to this @jollyswagmanpod with Mulheirn too https://t.co/VcAGF72dUQ @scientificecon @jbhearn @JoeBlob20 @financialeyes @homeatix

— Real-Estate Land Development Limited (@RealEstateLand3) January 15, 2023

https://t.co/5kMBnniw2x

— Real-Estate Land Development Limited (@RealEstateLand3) January 15, 2023
Picture

​en.wikipedia.org/wiki/Class_Struggle_(board_game)

​Varieties of rentierism

Financial rents. Financial rents are one of the ‘classical’ forms of rent. When Keynes (2018 [1936]: 334) famously called for the euthanasia of the rentier, it was the financial rentier – and the financial rentier alone – that he had in his crosshairs: the holder of financial assets or, in Keynes’s own terms, the ‘functionless investor’. For Keynes, the primary form of financial rent was the interest income ‘earned’ by holders of financial assets (such holders, as noted earlier, including households as well as companies). The speech marks are necessary because, in Keynes’s view, investors did not really earn this income. It came to them not by virtue of ‘genuine sacrifice’, but instead because capital was scarce – there was a limited amount of it – and thus borrowers were required to pay to access it. As Keynes saw it, there were no ‘intrinsic reasons’ why capital should be scarce. It was scarce, he surmised, simply because financial rentiers managed to keep it that way; hence his description of the ability of the financial-capitalist class ‘to exploit the scarcity-value of capital’ as a ‘cumulative oppressive power’

Land rents. Land rents are another classical form of rent. What gives the landowner the ability and right to charge a third party rent for using her land? In the most immediate sense, the law does. But the more fundamental answer is a combination of power, scarcity and geography. Without the power to exclude, as enforced by the law, land rent would be unimaginable. The power to exclude would itself be for little, however, if land were infinitely abundant. Land is finite – or, as the famous quip variously attributed to the American humourists Will Rogers and Mark Twain has it, ‘They’re not making any more of it’ – and this scarcity buttresses rent. Yet even though it is finite, and, under capitalism, subject to excludability, not all land generates a positive rent. This is because of geography. The ability to charge rent varies significantly across space, depending in particular on the attractiveness of land to potential tenants in terms of both the innate qualities of the site itself (such as soil fertility) and its relative locational merits (such as accessibility to local services). 

Natural resource rents.
Rents are generated from the subsurface as well as the surface of land, namely through exploitation of naturally occurring resources, including both energy products (oil, gas and coal) and other minerals (metal ores, stones, sands and salts). Indeed, natural resources are the specific source of rents for one of the most widely recognized types of rentier institution, the so-called ‘rentier state’. But obviously it is not just governments that enjoy such rents. Capitalist firms also do, and some of the biggest – the likes of BP, Glencore and Rio Tinto – are British.

Intellectual property rents. Many of the most valuable assets in contemporary capitalism are not physical assets such as land and non-land natural resources, but rather creations of the mind or intellect. Most creations of the mind, of course, are not ‘assets’ in the sense used in this article – nobody owns the concept of love or the knowledge of how to boil an egg. But some creations of the mind are owned, in so far as the law recognizes and polices exclusive property rights over those creations. This is the terrain of so-called ‘intellectual property’,

 A common example is the licensing and third-party use of proprietary software protected by copyright of the source code (and sometimes also by patents). To recognize this second model of IP rentierism is to appreciate that Microsoft is probably the most prolific rentier in capitalist history.
Spectrum rents.
The radio spectrum refers to a particular range of frequencies of electromagnetic energy that can be used for various types of communication. It is often likened to land; it represents, if you like, virtual real estate. Like land, it is a finite, or scarce, resource. And also like land, any part of the spectrum can accommodate only a limited number of uses; this is primarily due to the potential for interference

Platform rents. One of the most notable and important economic developments of the past two decades has been the emergence of the so-called ‘platform economy’ and the growing power of the owners of today’s leading digital platforms. While definition is tricky, the key functionality of a platform is arguably intermediation –

As Kenney and Zysman (2016: 68) write, ‘many platforms by their very nature prove to be winner-take-all markets, in which only one or two companies survive, and the platform owner is able to appropriate a generous portion of the entire value created by all the users on the platform’

Natural monopoly rents. A ‘natural monopoly’ can be defined in several ways, but perhaps the most useful definition is an industry in which the most efficient number of suppliers is one. Monopoly is said to be ‘natural’ in such cases because the introduction of additional suppliers would necessarily increase overall production costs and hence also the prices charged to customers. A classic example of a natural monopoly so-defined would be the regional or local physical supply of drinking water to businesses and households.

Contract rents. A longstanding mantra of the management consultancy industry has been that clients – in the public and private sectors alike – should focus exclusively on their socalled core competences and outsource all other activities.
Click to set custom HTML
0 Comments

From Homes for Heroes to Exponential Zeroes. Neglected actors in the “Housing Crisis” Narrative#AbsorptionRate, #LastTimeBuyers,#Cash Buyers, #FiscalPolicy ( #MIRAS and #StampDuty ) and #MortgageLending by the #BankingSector. #Demography of #Immigrat

1/2/2023

0 Comments


Homes for Heroes to Exponential Zeroes #AbsorptionRate #LastTimeBuyers #CashBuyers #FiscalPolicy #MIRAS #StampDuty #MortgageLending #BankingSector #Demography #Immigration #Ageing https://t.co/iknFPRPIRc @scientificecon @JoeBlob20 @financialeyes @jbhearn @UKFtweets @homeatix

— Real-Estate Land Development Limited (@RealEstateLand3) January 2, 2023
   

“Remember that we sometimes demand explanations for the sake not of their content, but of their form. Our requirement is an architectural one; the explanation a kind of sham corbel that supports nothing.”

― Ludwig Wittgenstein, Philosophical Investigations

From Homes for Heroes to Exponential Zeroes.

Neglected actors in the “Housing Crisis” Narrative

Absorption Rate, Last Time Buyers, Cash Buyers, Fiscal Policy ( MIRAS and Stamp Duty ) and Mortgage Lending by the Banking Sector. Demography of Immigration and Ageing.

From Homes for Heroes to Exponential Abstract Zeroes.

Summary.

Neglected actors in the “Housing Crisis” Narrative

#AbsorptionRate, #LastTimeBuyers,#Cash Buyers, #FiscalPolicy ( #MIRAS and #StampDuty ) and #MortgageLending by the #BankingSector. #Demography of #Immigration and#Ageing.

A road map for the Policy contexts of Housing supply. Demand Side and Supply side are broadly considered but a large lacunae in the literature is the relative influence of the segmentation in the Housing stock across tenures and relative to finance for Land and construction across tenures and Mortgages for the Owner occupation market. The Relative size of the New housing supply is considered and how influential are the different players in the Housing Market.

Introduction.

A week ago I decided to write a jaunty article on the “ Housing Market “ looking particularly at the Question of affordable homes. I came across a House of Lords debate from November 17, after deciding to see what recent articles on the “Housing Market” Came up in the BBC website search bar. The debate as is usual on this subject was somewhat polarised , with both sides for the most part not even tangentially seeking a context for the arguments about Supply problems , or Demand Problems In relation to Housing Stock or the Value of that stock in relation to the flow  of funds to purchase new stock or existing stock.

https://www.youtube.com/watch?v=rSO55-2gtDo

Lord Best in his contribution to the debate mentioned the Letwin Review , and the introductory analysis to the Full report from Sir Oliver, as the Charity Shelter’s  Blog  HeadLine put it. “Letwin Identifies the Problem but misses the Solution.” Shelter though

Fail to mention the most important insight that Sir Oliver makes in both documents.

“The fundamental driver of build out rates once detailed planning permission is granted for large sites appears to be the ‘absorption rate’ – the rate at which newly constructed homes can be sold into (or are believed by the house builder to be able to be sold successfully into) the local market without materially disturbing the market price.”

 In the Same debate Lord Lilley gave a good summary of the polarised arguments and added in some helpful dimensions to The demand question.

 “Until recently, the main driver of demand for housing was that households were becoming smaller”. “That used to mean we had to add 0.5% to the housing stock every year to cope with smaller households. That has come to an end.

Young people are now unable to leave home and are leaving later.

In 1999, 2.4 million adults aged between 20 and 34 lived at home with their parents.

By 2019, 3.5 million people in that age group lived at home with their parents.

So what is the reason?

“Over the last decade, the official figures show a net increase to our population of 2 million from those coming to settle here from abroad. That is equivalent to our having to build cities the size of Nottingham, Derby, Leicester, Middlesbrough, Carlisle, Oxford, Exeter, Portsmouth and Southampton, every decade, just to keep up with the net inflow from abroad.

If we allow a continued net inflow of 200,000 or 300,000 into this country, we have to build extra houses on top of the demand of the domestic population that is already here”

The Polarisation of the discourse into two broad groupings is explained in an interesting paper

Framing The Housing Crisis by Chris Foye of Henley Business school , University of reading.

“To conclude though, I want to focus on two trends these think-tanks’ framings shared in common. First, all three think-tanks agreed that a shortage of supply was the main ‘cause’ of housing unaffordability. Inversely, there was almost no reference to the role of demand-side factors, such as interest rates, mortgage market liberalisation, the income elasticity of demand or income/wealth in- equalities, all of which are recognised by neoclassical economists to have comparably large effects on house prices and affordability"

(Meen and Whitehead, 2020).

“The end result is that the debate becomes “bedevilled by rival simplifications” as Edwards (2015) recently described the English housing crisis discourse.”

The Following is a brief summary of where my contextual endeavors for putting dimensions on the “Housing Market”, as ever as I developed my own thoughts and clarified my own thinking

I found that the more I pared down my questions I found more nuanced answers but more answers on the supply side school of thought. I  ended here with a partial route map

For some of the roads I have traveled.

Another Book now to read.

Understanding Affordability: The Economics of Housing Markets

Yet

“there was almost no reference to the role of demand-side factors, such as interest rates, mortgage market liberalisation, the income elasticity of demand or income/wealth in- equalities”

“ I wanted to write that my work consists of two parts: of the one which is here, and of everything which I have not written. And precisely this second part is the important one.”

  • On his Tractatus Logico-Philosophicus, in a letter to Ludwig von Ficker (1919), published in Wittgenstein : Sources and Perspectives (1979) by C. Grant Luckhard

Has the tide turned for Europe’s banks? -

Has the tide turned for Europe’s banks? Despite rising rates in 2022, only two of the 20 largest European lenders trade above book value 

Happy new year, 2023 .

This FT article sets the tone for the Magic money tree narrative renaissance. It was more and more noticeable as 2022 progressed. Will we see  

A European Sovereign debt crisis? It's an obvious route to get Stirling back in the EURO fold with a hair shirt to boot.

The prospects for looting remain teed up , and with Bailey still at the BOE, I think Dash for cash 2 is upon us.

https://www.buzzfeed.com/heidiblake/dash-for-cash

[caption id="attachment_22861" align="alignnone" width="600"]ITS ALL DONE WITH SWAPS. TTIP , AADHAAR , THE DEHLI FARMER PROTESTS #ID2022 Aadhaar and the post 2008 Looting? Buzz Feed Article The Dash For Cash.[/caption]

The same play book is evident already in the buy to let mortgage market, where the Vultures are gathering, Blackrock andLloyds chief amongst them.

I have been researching an article on the Affordable Housing question?

I am keen to make progress on theHBF deposit unlock scheme with Home@ix group this year, and think a Rentenmark style bond aimed at bank of mum and Dad, last movers is an insight my Christmas period research has revealed.

See.

[caption id="attachment_28823" align="aligncenter" width="798"] Last-time buyers
The challenges and opportunities for 55+ home-owners
wanting to move home[/caption]

A mortgage a day helps you live rent and pay

PAY RENT AND LIVE

Two prices ( Mulheirn )

#96: The Housing Supply Myth â Cameron Murray & Ian Mulheirn

The Housing Supply Myth – Cameron Murray & Ian Mulheirn

https://josephnoelwalker.com/96-the-housing-supply-myth-cameron-murray-ian-mulheirn/

@52.18.

"The 5th thing is the misunderstanding that there are two markets here.

You have two markets, Two prices

The Market for housing services is the Rental Market

The Market for housing assets is the House Price

Just Like Cameron's example of the I Phone price versus the Apple Share Price.

These are different markets with different prices and people just don't get

that!"

Ian Mulheirn.

Tackling the UK housing crisis: is supply the answer?2019

Context Demand side and Effective demand Mortgage not Land reform.pdf

Rent, buy   ( Wrigley)

6.  Legitimate government spending generally provides infrastructure, services and welfare payments to resident people and businesses. To benefit from this government spending, a person must own or rent a home or operate a business in the area. The monthly amount people pay to occupy their homes is set in the marketplace, based upon location and the value of natural, commercial and government amenities provided. Landlords charge monthly for these location amenities while home sellers charge a lump sum.

Functions of Money fungible etc store of value

The following points highlight the top six functions of money.

  • Function # 1. A Medium of Exchange: ...
  • Function # 2. A Measure of Value: ...
  • Function # 3. A Store of Value (Purchasing Power): ...
  • Function # 4. The Basis of Credit: ...
  • Function # 5. A Unit of Account: ...
  • Function # 6. A Standard of Postponed Payment:

Property as a security/surety/collateral

The origins of the word 'mortgage' will make you think twice about buying a house

"Word nerds will notice an eerie root word in 'mortgage' — 'mort,' or 'death,'" Weller writes. "The term comes from Old French, and Latin before that, to literally mean 'death pledge.'"

The Historic Periods.

1.1 .Post World War 1.

Demand for houses had built up since, and as a consequence of low levels of building during the war; the number of families increased;(2) migration occurred from the more depressed areas to the South and Midlands; and local authorities took a larger share of house completions during the twenties. From 1932, RPDI grew sharply, after stagnating since 1928 (Chart 13).

The result was a sharp rise in private completions from 1932 (Chart 14)( 3)

Although there are some similarities between financial innovation in the thirties and today it seems unlikely that a revival in housebuilding on the scale that took place then will recur. Several of the features of the thirties are lacking today. Interest rates have fallen in nominal terms, but remain high in real terms by the standards of the seventies. Real incomes are not rising strongly, and building land is in rather inelastic supply. The housing stock is high in comparison to the population over nineteen( years of age)(l) by recent standards, after some years of rapid growth in the sixties; and migration of population within the United Kingdom is not occurring on the scale of the thirties. Recent demographic trends which imply more rapid growth of the adult population in the next decade, and the slowdown in building, may presage a degree of pent-up demand in future years, but do not seem to be influential as yet.

1.2 Post World War 2.

Bank of England Quarterly Bulletin: September 1982

This analysis has placed little emphasis on the demand for

loans, since rationing was in force for much of the period.

Clearly, however there were periods when queues were

short: but these were generally at times when interest rates

and other factors combined to produce weak demand. Thus

in 1973 and 1974 high rates were coupled with flat or falling

real incomes, and this pattern was repeated in 1977. In

periods of high and increasing demand, rationing by

building societies became important.

Other institutions did not generally fill the vacuum created

by rationing. Local authorities and insurance companies

have made a comparatively minor contribution, as have

banks until rather recently. This is in contrast to experience

elsewhere; for example, in the United States, banks account

for 17% of outstanding housing loans, and 45% in France,

compared with about 7% in the United Kingdom in 1981.

Homes fit for heroes – interwar policy[edit]

In 1912, Raymond Unwin published a pamphlet Nothing gained by Overcrowding.[19] He worked on the influential Tudor Walters Report of 1918, which recommended housing in short terraces, spaced 70 feet (21 m) apart at a density of 12 per acre (30/ha). The First World War indirectly provided a new impetus, when the poor physical health and condition of many urban recruits to the army was noted with alarm. This led to a campaign under the slogan "Homes fit for heroes". In 1919, the Government first required councils to provide housing, built to the Tudor Walters standards, under the Housing, Town Planning, &c. Act 1919 (Addison Act), helping them to do so through the provision of subsidies.[20][21] London County Council embraced these freedoms and planned eight 'cottage estates' in the peripheries of London: Becontree, St Helier, Downham for example; seven further followed including Bellingham. Houses were built on green field land on the peripheries of the urban area. The war had caused house building costs to rise enormously: Sir Ernest Simon reported to the Manchester Housing Committee in 1910 that "houses that had cost £250 to build pre war were then costing £1,250, so the economic rent was 30/- a week but had to be let at 12/6d".

The provision of local authority housing varied throughout the UK; in the period 1919–39 67% of the houses built in Scotland were in the public sector, compared to 26% in England.[22]

Mortgage lending and the housing market Bank of England Quarterly Bulletin: August 1995

This article, which has been prepared mainly by E P Davis and I D Saville of the Bank's Economics Division, argues that:

• Now the banks have entered the housing market in a major way, the market for mortgages is more likely to be cleared mainly by interest rate movements rather than by rationing.

• The recent sharp rise in mortgage lending reflects the removal of restrictions, allowing persons to increase their capital gearing, and probably does not reflect a significant rise in the demand for housing.

 • A substantial part of mortgage lending does not ultimately finance new or improved housing, but is available for the acquisition of other assets or other spending.

 • House prices are somewhat low in real terms, and may recover in the course of the next few years.

A Right to build , Parvin.p.10

1.3 The 1970’s Boom and Bust


The housing market and the economy By Joanne Cutler of the Bank’s Structural Economic Analysis Division.

Summary

Fluctuations in house prices are relevant to a broader economic assessment,(1) because of the information they can contain both about household expectations and about demand and price pressures in the economy.

 Developments in the housing market over the past few years ( Published in 1995)--including arrears and possessions, and negative equity—have increased the perceived risks of borrowing for house purchase.

 In addition, lower general inflation is likely to mean that the demand for housing as a hedge will be reduced. A climate of price stability may also lead to smaller fluctuations in real house prices, as uncertainty about the rate of return from housing is reduced; in the past, changing expectations have been an important source of volatility in real house prices. Moreover, both lenders and borrowers may shift towards lower desired loan-to-value ratios to take account of the likelihood that with lower general inflation house price falls may occur from time to time.

1.4 The 1980’s Boom and Bust

Dispossession: The Great Social Housing Swindle

The film focuses on the long term effects of the Right to Buy policy implemented by the United Kingdom Government in the 1980s. It is argued that the selling of publicly owned housing to its tenants, and the subsequent policy of renewal, has led to gentrification and a form of social cleansing. This has resulted in the disintegration of communities, and local authorities being unable to provide adequate housing for those in need.[2]

The film includes interviews with social geographer Danny Dorling and working class academic Lisa Mckenzie. There are also interviews with journalists Peter Hitchens, Dawn Foster and Deborah Orr; as well as prominent politicians Nicola Sturgeon; Caroline Lucas and other Members of Parliament with an interest in the issue.

Areas featured include Gorbals and Govanhill in Glasgow where the council has transferred its stock to a housing association; as well as two estates in London being faced with demolition: Cressingham Gardens and the Aylesbury Estate.

  The housing market and the economy By Joanne Cutler of the Bank’s Structural Economic Analysis Division.

1.5 The 1990’s Boom and Bust

Banded England and wales sales activity and Average Price..pdf

https://www.youtube.com/watch?v=AriCsf6K_vQ

1.6 The Naughties Boom and Bust

1.7 The Teens to the Pandemic

[caption id="attachment_28846" align="aligncenter" width="1094"] repo spike 2019[/caption]

Fluctuations in Tenure ratios.

1.8 The Pandemic Urban Flight

Stock of Housing , Mortgages, Cash and first time buyers Spread sheet.ods

housing market banded-country-England and Wales-by-district-old and newbuild-1995 to may 2022

The-changing-shape-of-the-UK-mortgage-market-FINAL-ONLINE-Jan-2020.pdf


The Supply Side.

2.1  Land and Planning Central and Local Government

2.2  Housebuilders

A right to build Parvin 2011 p.

2.3  SME’s

The financialisation of housing production: exploring capital flows and value extraction among major housebuilders in the UK. 

The changing shape of the UK housebuilding sector The recent fnancial and operational performance of large UK house building firms should be set within the context of long-term structural changes in the sector. The development of large housebuilders in the form of public limited companies (PLCs)—giving them greater access to development finance and enabling them to exert more power in land markets—has been crucial to this process. In 1980, there were over 10,000 small and medium ​enterprise (SME) housebuilders active in Great Britain, building 57% of all new housing; by 2014, this had dropped to 3000 SME builders delivering just 27% of all new dwellings (Lyons 2014).

2.4 The Contracting Business, From Egan review to The Farmer Review.

1998. The Egan Report, Rethinking Construction.

1999. Towards an Urban Renaissance. Urban Task Force.

1999. A better quality of life – a strategy for sustainable development for the United Kingdom. Government.

2000. Building a Better Quality of Life: A strategy for more sustainable construction, Department of the Environment, Transport and the Regions.

2001. Modernising construction, National Audit Office. .

2002. Rethinking Construction 2002: Achievements, Next Steps, Getting Involved, Rethinking Construction Group Ltd.

2002: Accelerating change: A report by the Strategic Forum for Construction, chaired by Sir John Egan.

2002 Fairclough Report, Rethinking Construction Innovation and Research: A Review of Government Policies and Practices. DTI and DTLR.

2005. The Urban Renaissance six years on. Urban Task Force.

2007. Callcutt Review of Housebuilding Delivery, John Callcutt

2007. Place-shaping: a shared ambition for the future of local government, Lyons Inquiry into Local Government, Sir Michael Lyons.

2009. Never waste a good crisis. Andrew Wolstenholme, Constructing Excellence.

2011. Laying the foundations: a housing strategy for England, HM Government.

2012. Government Construction Task Group, Government Construction Strategy: Final Report of the Procurement/Lean Client Task Group. July 2012.

2014. Our future in place, The Farrell Review of Architecture + the Built Environment (FAR). Sir Terry Farrell.

2014. Property in politics. Royal Institution of Chartered Surveyors (RICS).

2014. Lyons Housing Review ‘Mobilising across the nation to build the homes our children need'. 16 October 2014.

2014. Going for growth, Reviewing the Effectiveness of Government Growth Initiatives. All Party Urban Development Group. 17 November 2014.

2015. Fixing the foundations: creating a more prosperous nation. 10 July 2015

2015. A brighter future for our towns and cities, A report from the Commission for Underperforming Towns and Cities. The Institute of Economic Development (IED).

2016. Building Better Places. The Committee on National Policy for the Built Environment, 19 February 2016.

2016. Government Construction Strategy 2016 2020. Infrastructure and Projects Authority, 23 March 2016.

2016. Farmer Review 2016: Modernise or die

2017. Housing White Paper: Fixing our broken housing market. 7 February 2017.

2.4 Banking for Land and Construction procurement.

https://www.ukfinance.org.uk/news-and-insight/press-release/uk-finance-reports-shift-in-lending-needs-smes-caution-rises

Lord Best

There are a dozen urgent measures that could and should provide temporary relief, but we also need to address the underlying cause of this national failure. What would make the biggest difference to getting more homes built—as the noble Lord, Lord Lilley, suggests we need to do—and galvanising the process of reducing the disastrous housing shortages? Top of my wish list for fundamental change is the adoption of the mechanisms for land value capture advocated by Sir Oliver Letwin in his 2018 review. Sir Oliver got to the heart of why we have been failing, year after year, to build what we need. Yes, we should resource our local planning departments to speed up the planning process, but that is not why we get such a slow build-out of new developments and build so few new homes affordable to the half of the population on average incomes or less, or why we have developments that continuously fail us on so many counts. We also see SME builders being excluded, despite those firms often being more in tune with local needs, the local vernacular and the local labour market. The housebuilders’ business model requires them to fight, with their lawyers and consultants, for the minimum number of affordable homes—the maximum number of properties they can squeeze on to a site, with the least green infrastructure and the fewest amenities, and to build at a speed that ensures the continuing scarcity that drives up prices. Our system rewards the very actions by housebuilders most at odds with the public interest. Instead, the Letwin review tells us we should take back control. Letwin puts the scale at 1,500 homes but his formula is just as applicable for 150: for every major development, land should be acquired at a price that relates to its current use—for example, for agricultural land, Letwin suggests paying no more than 10 times the agricultural value— with a master plan that determines what is built and parcels out sites to different builders and providers, for a range of uses and tenures. Having bought the land at a reasonable price, using compulsory purchase powers if necessary, a development becomes viable that actually and promptly delivers the social benefits missing today. To achieve this upending of the current, highly unsatisfactory process, Letwin proposes local authorities establish arm’s-length development corporations, as is quite possible under existing law. These would borrow the finance to buy the site and capture the land value uplift. The development corporation’s master plan can then incorporate all the features of healthy place-making.

Transfer of Local Authority Housing to Housing Associations

Housing Associations growth

Revenue from Right to buy and investment in new stock.

Local Authority ability to Borrow to build.

3.The Demand Side.

3.1 The Owner Occupation and Rental Market

3.2. Social , Local Authority Housing and Housing Associations

3.3 Buy to Let ( BTR) (PRS) FOr Profit Social Rent.

3.4. Mortgage Provision

Interest Component of Capital Expenditures

THE MONEY SYNDROME is therefore unique among books on economic

topics. There are three titles that it could be compared with:

•Margrit Kennedy, Interest and Inflation Free Money. This book which

was largely inspired by Helmut Creutz’ work, can be seen as a more

popular summary of THE MONEY SYNDROME. The fact that this book

has been translated into eighteen languages up to now may indicate

a growing worldwide interest in the topic.

•Gero Jenner, Das Ende des Kapitalismus. Triumph oder Kollaps eines

Wirtschaftssystems?, Frankfurt/M. 1999, Fischer Taschenbuch Verlag

(Link in German only: The End of Capitalism. Triumph or Collapse of

an Economic System?) While relying on data from Helmut Creutz’

book as a standard work of reference, the author lays emphasis on

international scale industrial and sociological effects.

•Bernard Lietaer, The Future of Money, 2001, Random House.

Impressed by a rapid worldwide increase of alternative models of

economy, such as local exchange trading and barter systems, he

probes deeply into the psychological and sociological implications of

money. As a former manager of the Belgian National Bank Lietaer

also promotes an innovative global reference currency similar to

Keynes’ proposal of “Bancor”.

Margrit Kennedy: Interest and Inflation Free Money

4.The Housing Crisis Debate.

In sum, all three think-tanks occupied very different positions in relation to the fields of science, media, and politics (and less significantly, business), and this can help us explain why their framings of the housing crisis diverged. To conclude though, I want to focus on two trends these think-tanks’ framings shared in common. First, all three think-tanks agreed that a shortage of supply was the main ‘cause’ of housing unaffordability. Inversely, there was almost no reference to the role of demand-side factors, such as interest rates, mortgage market liberalisation, the income elasticity of demand or income/wealth inequalities, all of which are recognised by neoclassical economists to have comparably large effects on house prices and affordability (Meen and Whitehead, 2020). This ‘supply shortage’ framing has not gone without contest. In the last decade, there have been several attempts to challenge the idea that housing unaffordability is due to a shortage of supply, most recently from Mulheirn (2019). Yet, these challenges have had little traction, much to the consternation of some economists.18

These demand-side framings are unpopular among New Urban Economists, and challenge the efficacy of free-markets, so it is unsurprising that both Centre for Cities and Policy Exchange have eschewed them. But why did Shelter – or other left-leaning think-tanks - not advance these demand-side framings? The answer becomes clear once we recall Shelter’s anchoring in the field of politics. As discussed, one consequence of the framing strategies pursued by think-tanks is that causal narratives become increasingly politically contingent, evaluated not only on the basis of their explanatory power but also on the perceived short-term feasibility of the policy solutions that flow from them. Put simply, demand-side explanations were eschewed by Shelter (and other organisations seeking to influence policy) because they were perceived to imply policies, such as wealth redistribution, which are judged politically unfeasible (at least in the short-term). As Toby Lloyd described Mulheirn’s demand-side framing “it’s just not useful as it doesn’t lead to any meaningful solutions”.19 This likely explains why supply-side framings of the housing crisis continue to dominate in the English policy discourse more generally.

Framing the Housing Crisis. Foye 

August 2022

2022 Framing The Housing Crisis

The other trend that the three think-tanks have in common is that

they have all become more disciplined in their framings since 2017.

Whether it was Shelter’s campaign for land reform, C4C’s campaign for

planning reform; or PX’s Building Beautiful Agenda – all three of these

only became prominent after the 2016 EU referendum. Before then, the

Framing strategies of all three think-tanks were much more disparate.

Again, one explanation for this trend relates to changes in the field of

politics on which all three think-tanks are dependent, albeit to varying

degrees. When the Cameron administration won an overall majority in

2015, they came back into power with an ambitious programme for

housing and planning policy reform (e.g. Planning Bill 2015–16). This

pushed the think-tanks (especially Shelter and Centre for Cities) onto the

back-foot, forcing them to react to the government’s agenda. However,

after the EU referendum and the supplanting of David Cameron by

Theresa May, there was a vacuum in policymaking, which likely allowed

think-tanks to be much more proactive in pushing their own agendas.

More specifically, what think-tanks do is to frame the science. The defining feature of any successful political narrative lies in providing a simple and flexible story that succinctly links together a series of ‘symptoms’ with a cause while attributing blame (Hay, 2001: 204; Stanley, 2014). This is what framing seeks to achieve. Defined by Entman and Rojecki (1993: 52) as “the process of selecting and emphasising aspects of complex issues according to an overriding evaluative or analytical criterion”, framing involves two acts: first it presents a highly selective, but not factually inaccurate, picture of the scientific evidence; second, it entwines the evidence with a particular policy recommendation so that the positive and normative become indistinguishable.

By entwining the evidence with their preferred policy-agenda – e.g. “house price inflation is caused by planning constraints” – framing strategies allow think-tanks to advance preferred policy agendas under the auspices of pure scientific enquiry (Daviter, 2011). Moreover, it allows them to do so in a tightly condensed format that is better equipped to survive in the fields of politics and media where the competition for capturing attention is intense (Dayan and Katz, 1992, Baert, 2012). The corollary of these framing strategies though – and of the structural logics to which they conform – is that causal narratives become increasingly politically contingent. The decision of which cause to emphasise is made not only on the basis of that cause’s explanatory power but also on the perceived short-term feasibility of the policy solutions that flow from it.

Framing strategies also lead the debate to become increasingly reductive. Rather than engaging with opposing causal explanations and policy proposals in good faith, there is a tendency instead to just crowd them out of the fields of media and politics, through relentlessly repeating the same frame, thus capturing the scarce attention of the public and policymakers (Dayan and Katz, 1992, Baert, 2012). The end result is that the debate becomes “bedevilled by rival simplifications” as Edwards (2015) recently described the English housing crisis discourse.

Contemporary Books.

Chloe Timperly Generation Rent

Liam Haligan  2019. Home Truths: The UK’s Chronic Housing Shortage – How it Happened, Why it Matters and How to Solve It. Biteback

The odds on ending our housing emergency improved this weekend after the Daily Telegraph revealed that Tony Pidgley, founder and chairman of Berkeley Group, has joined the ranks of the country’s growing coalition for land reform. Speaking to journalist Liam Halligan for the new book Home Truths: The UK’s chronic housing shortage, Pidgley describes a housebuilding system ‘in dire need of reform’, and calls for landowners and developers to be forced to share profits of new housing developments with communities, saying: ‘The whole of society should capture that value – it’s about decency.’ https://blog.shelter.org.uk/2019/11/sajid-javid-berkeley-homes-boss-join-land-reform-campaign/

Colenutt The Property Lobby

The Property Lobby

The Hidden Reality behind the Housing Crisis

By Bob Colenutt

https://www.youtube.com/watch?v=CbK-oxFGyDg

4.1  Demographics

4.2  Wages and  employment

4.3  Mortgage Market.

4.4  Cash Buyers

4.5  Bank of Mum and Dad

4.6. The Housing Ladder

4.7  Generation Rent and Student Debt.

Housing Shortage

In 2020, the BBC reported the UK's housing gap was in excess of one million homes,[26] and previously (in 2019) that "An estimated 8.4 million people in England are living in an unaffordable, insecure or unsuitable home, according to the National Housing Federation".[27] Unaffordable housing is defined by the Affordable Housing Commission as to where housing costs are above 30% of household income.[28] In a government briefing paper, 'Tackling the under-supply of housing in England',[29] Barton and Wilson describe England's housing need as being illustrated by issues "such as increased levels of overcrowding, acute affordability issues, more young people living with their parents for longer periods, impaired labour mobility resulting in businesses finding it difficult to recruit and retain staff, and increased levels of homelessness".[29]

Despite an added 244,000 homes to England's housing stock in 2019/20, the notion that an increased supply of housing will improve affordability has been challenged: the UK Housing Review (September 2017) states, "Indeed as the evidence to the Redfern Review from Oxford Economics reminds us, it is unlikely to bring house prices down except in the very long term and with sustained high output of new homes relative to household growth. Even boosting (UK) housing supply to 310,000 homes per annum in their model only brings a five per cent fall in the baseline forecast of house prices".[30] Therefore, the National Housing Federation (NHF) and Crisis from Heriot-Watt University argue that alongside the needed 340,000 new homes each year (until 2031), 145,000 of those “must be affordable homes”.[29][31]

5.Housing Stock

The outstanding value of all residential mortgage loans was £1,527.3 billion at the end of 2020 Q3

two thirds of households own the house they live in; half of these are still paying off their mortgage

28,536,000 Dwellings

29,180,071,800 sq ft 29 Billion Sq Ft .

Housing_Supply_England_2020-21.pdf

The-Housing-Stock-of-the-United-Kingdom_Report_BRE-Trust.pdf

5.1 Land

https://abcfinance.co.uk/blog/who-owns-the-uk/

Amberfield Land RICS.

https://www.designingbuildings.co.uk/wiki/Amberfield_land

On 15 September 2014, the Royal Institution of Chartered Surveyors (RICS) published 'Property in Politics', a report which it claimed set out a bold new vision for the property market. The report followed the largest ever consultation carried out by the RICS.

One of the key recommendations of the report was that a new land classification should be created, ‘amberfield land’, which would identify ‘ready to go land’. It suggested that creating a pipeline of ready-to-go amberfield land would increase the supply of housing and create new development opportunities.

Amberfield land would be an addition to the existing classifications of:

  • Greenbelt or ‘greenfield land’ – which establishes a buffer zone between urban and rural land, and
  • ‘Brownfield land’ – defined in Planning Policy Statement 3 (PPS3) in 2010 as ‘previously-developed land…which is or was occupied by a permanent structure.

6.Money Supply and Mortgages

6.1 Utilising the Quantity Theory of Credit to Understand the Causes of the 2007 Financial Crisis

6.2 Council for Mortgage Lenders.( CML)

6.3 CML response to Calcutt review,

http://opinion-former-resources.politics.co.uk/microsites2/364298/graphics/callcutt.pdf

24 April 2007

Introduction

1. The Council of Mortgage Lenders (CML) is pleased to respond very briefly to the

Callcutt review of housebuilding delivery.

2. The CML is the representative trade body for the residential mortgage lending

industry. Its 161 members currently hold over 98% of the assets of the UK mortgage market.

3. The CML and its members naturally focus directly on the UK mortgage market and

their interest in the house building market derives from that focus. Nevertheless, lenders are

the key funders of home purchase and thus indirectly support new house building. It should

not be forgotten that mortgage lenders provide funds both for home ownership and the private

rented sector. In addition, the CML members have also lent c. £40 billion UK-wide for newbuild, repair and improvement in the social rented sector.

4. Because of the key role played by lenders in the house building process, it is

important that they are fully involved in policy discussions aimed at influencing the house

building market. Failure to consult properly carries the risk that markets may be distorted

because property may be intrinsically unmortgageable or because supply or demand factors

may render categories of property unattractive as security for loans

5. This brief response will focus on two areas where government has influenced the

house building market in unintended ways and where better consultation with the mortgage

industry might have created a happier result.

Modern methods of construction (MMC) and mortgageability

6. Because of the key funding role of lenders it is important that those involved in house

building are aware of the features of properties that allow lenders to use them as security for a

mortgage loan of up to 35 years term. Briefly these features are:

• A life span of at least 60 years;

• Whole life costs comparable to traditional construction;

• Repair costs comparable to traditional construction and the ability to repair a property

using normal (local) trades;

• The potential for the property to be adapted over its lifetime without excessive cost or

difficulty, eg, to add a porch or conservatory; and

• Buildings insurance to be available on normal terms.

7. Past generations of non-traditional construction have failed to meet prudent lending

criteria on one or more of the counts set out above. Lenders (along with owners) are the

longest term stakeholders in a property and are rightly cautious about the value of their

security over the mortgage term.

8. Government has properly been concerned about overall housing supply. As part of its

drive to create a step change in supply ministers have supported increased use of MMC

through exhortation and directly via through the distribution of grant for new build by

housing associations and others. This has led to an increased use of MMC designs

particularly by housing associations building for rent or sale for low-cost home ownership.

9. Unfortunately, by no means all MMC designs meet the criteria set out above, and this

has led to some confusion as to which properties are mortgageable. In some cases, properties

have been built by housing associations with the intention of moving to open market sale

without prior discussions about mortgageability. Pressure by government to adopt modern

methods rather than simply to build efficiently has played a part in creating uncertainty. In

addition their failure to consult has meant that recognised standards in the area of MMC were

not in place at an early stage and this has undermined confidence of both lenders and

consumers.

10. For its part the CML has engaged with the Building Research Establishment to

develop a certification standard for MMC properties that will recognise and meet the needs of

both lenders and buildings insurers. The new standard − known as LPS 2020 is still under

development but should make a valuable contribution to improving new build quality in

this area.

Planning

11. Government has the ability to influence (and distort) markets through modifications to

the planning system. Two examples will suffice.

New-build flats

12. As part of its package of measures to boost housing supply, the government has,

through changes to the planning guidance, created a situation where the proportion of newbuild flats has increased dramatically. As a result, there are anecdotal reports of localised

over-supply of new-build flats in urban areas, manifested in problems in selling such

properties and in difficulties for owners in selling properties at their original valuation. In

some cases, rental values have also been less than expected. Some lenders have reacted by

tightening their lending criteria in relation to new-build flats. This is a situation that could

have been avoided by better consultation with stakeholders including lenders. Indeed, the

CML wrote to the Minister Yvette Cooper MP some two years ago on this subject.

S. 106 agreements

13. A neglected aspect of housing supply is the difficulties lenders have been facing with

restrictive covenants imposed by some local planning authorities through planning

obligations (ie, s. 106 agreements) for affordable housing. Despite recent guidance from

DCLG local planning authorities (LPAs) are still adopting different approaches to affordable

housing in s. 106 agreements and lenders find it very difficult to deal with the variety of

restrictions being imposed. Lenders are finally are beginning to see the adoption of 'cascade'

mechanisms to deal with restrictions on rural exception sites under PPG3. This means that

instead of lenders never being allowed to sell the property on the open market, the number of

eligible people is gradually increased until a buyer is found. The cascade has to take placed

within a limited time period. However, these mechanisms are not being adopted universally

and there is a danger that lenders will withdraw support for these schemes if this does not

happen. This example highlights the need for local as well as central government to be

sensitive to the needs of key stakeholders and for central government to enforce its guidance

effectively.

Consultation

14. The key message of this brief response is that lenders are an important stakeholder in

the house building process, though they are sometimes forgotten. It is vital that government

and other players in this market engage lender representatives fully in planning measures that

can have a significant impact upon the market.

Contact

15. This response has been produced by the CML in consultation with its members.

Comments and queries should be addressed in the first instance to Andrew Heywood, Deputy

Head of Policy:

Telephone 020 7438 8933

Email: Andrew.heywood@cml.org.uk

7.Mind Map of the Policy review minefield.

8. KEY Construction industry and Housing Crisis Reports .

This article presents a list of key reports about the UK construction industry. Detailed articles are available about some of these reports, which can be accessed by clicking on the links, and more will be added.


1934. Building to the skies. Alfred Bossom.

He wrote, ‘The process of construction, instead of being an orderly and consecutive advance down the line, is all too apt to become a scramble and a muddle.’

He also saw that this inefficiency impacted on the wider economy, writing, ‘All rents and costs of production throughout Great Britain are higher than they should be because houses and factories cost too much and take too long to build… Bad layouts add at least 15% to the production of the cotton industry. Of how many of our steel plants and woollen mills, and even our relatively up-to-date motor works, might not the same be said? The battle of trade may easily be lost before it has fairly been opened – in the architect’s design room.’

Similar criticisms have followed Building to the Skies, most notably; the Latham Report, Constructing the Team in 1994; The Egan Report, Rethinking Construction in 1998; the Government Construction Strategy in 2011 and Construction 2025, published in 2013.

Sir Michael Latham described the UK construction industry as ‘ineffective’, ‘adversarial’, ‘fragmented’ and ‘incapable of delivering for its customers’, largely the same points as those set out by Bossom.

1940. Barlow Report. Royal Commission on the Distribution of the Industrial Population (Barlow Commission)

The Barlow Report, Royal Commission on the Distribution of the Industrial Population (referred to as the Barlow Commission) was commissioned by Royal Warrant on 8 July 1937 to investigate the distribution of industry and to propose remedies to the perceived disadvantages of a concentrated population. It was chaired by Sir Montague Barlow.

The Barlow Commission followed the Third Report of the Commissioner for ‘Special Areas’ published in 1936, relating to the imbalance in the distribution of industry and industrial populations due to the decline of some heavy industrial areas and the concentration of light industry and distributive trades around London.

The Barlow Commission Report, published in 1940, proposed the decentralisation of industry and its populations and recommended the creation of a board for industrial location.

The war prevented its immediate implementation but the report had a significant influence on post-war reconstruction and set the foundations for a formal new towns programme, culminating in the New Towns Act 1946 and triggering a major shift towards the building of new towns.

 2004 The Barker Review of Housing Supply

2006. DFMA Lessons Learnt 60 K house competition DTI

2007. Callcutt Review of Housebuilding Delivery, John Callcutt

callcuttreview_221107 (1).pdf

The Callcutt review of housebuilding delivery Response by the Council of Mortgage Lenders to the call for evidence

JOHN CALLCUTT WAS COMMISSIONED BY THE GOVERNMENT TO LOOK INTO “HOW THE SUPPLY OF NEW HOMES IS INFLUENCED BY THE NATURE AND STRUCTURE OF THE HOUSE BUILDING INDUSTRY, ITS BUSINESS MODELS AND ITS SUPPLY CHAINS”.


As a former head of English Partnerships and chief executive of Crest Nicolson, John Callcutt has the experience needed to answer the questions set by the review, such as: “Does the prevailing business model of the house building industry constrain how it responds to demands?”


John Callcutt said: “This review will make recommendations on how we can improve the delivery of new homes to reach the government’s targets while also achieving high standards of energy efficiency and sustainability.”

CML response to Calcutt review,

http://opinion-former-resources.politics.co.uk/microsites2/364298/graphics/callcutt.pdf

24 April 2007

2011 Laying the Foundations: A Housing Strategy for England

2014 Lyons_Housing_Review 2014.

https://www.designingbuildings.co.uk/wiki/

Rebekah Paczek from snapdragon consulting assesses the 180-page Lyons Housing Review ‘Mobilising across the nation to build the homes our children need', which was published on 16 October 2014.https://www.yourbritain.org.uk/uploads/editor/files/The_Lyons_Housing_Review_2.pdf

  • Labour do not want to ‘help to buy’ but instead ‘help to build’, underwriting loans for small house builders.

2015 Fixing the foundations: Creating a more prosperous nation

Starter Homes

9.23 The government will deliver its commitment to get 200,000 Starter Homes built by 2020,

at a 20% discount for young first time buyers. The government is bringing forward proposals to

help deliver this commitment, which include:

 requiring local authorities to plan proactively for the delivery of Starter Homes

 extending the current exception site policy, and strengthening the presumption in

favour of Starter Home developments, starting with unviable or underused

brownfield land for retail, leisure and institutional uses

 enabling communities to allocate land for Starter Home developments, including

through neighbourhood plans

 bringing forward proposals to ensure every reasonably sized housing site includes a

proportion of Starter Homes

 implementing regulations to exempt these developments from the Community

Infrastructure Levy, and re-affirming through planning policy that section 106

contributions for other affordable housing, and tariff-style general infrastructure

funds, will not be sought for them

 putting in place new arrangements to monitor their delivery

9.24 The government is committed to extending the Right to Buy to housing association

tenants. Since the Right to Buy for council tenants was reinvigorated in the last Parliament, the

number of sales has increased by nearly 320%.15 The government will extend the same

opportunity to buy to the tenants of housing associations through the Housing Bill, to be

introduced in this session of Parliament.

9.25 In the Spending Review, the government will take further steps to re-focus Department for

Communities and Local Government (DCLG) budgets, focussing on supporting low cost home

ownership for first time buyers.

Buy to Let

9.26 The current tax system supports landlords over and above ordinary homeowners. Landlords

can deduct costs they incur when calculating the tax they pay on their rental income. A large

portion of those costs are interest payments on the mortgage. Mortgage Interest Relief was

withdrawn from homeowners 15 years ago. However, landlords still get the relief. The ability to

deduct these costs puts investing in a rental property at an advantage. Tax relief is particularly

beneficial for wealthier landlords with larger incomes, as every £1 of finance cost they incur

allows them to pay 40p and 45p less tax respectively. The Bank of England has also noted in its

recent Financial Stability Report that the rapid growth of buy to let mortgages could pose a risk

to the UK’s financial stability.

9.27 The government will restrict the relief on finance costs that landlords of residential property

can get to the basic rate of tax. The restriction will be phased in over 4 years, starting from April

2017. This will reduce the distorting effect the tax treatment of property has on investment and

mean landlords are not treated differently based on the rate of income tax that they pay. It will

also start to shift the balance between landlords and homeowners.

2016 Redfern Review  16 November 2016

Redfern review into the decline of homeownership

The Review highlights the fact that whilst 80% of people see home ownership as the preferred form of tenure, there has actually been a significant fall in home ownership in England, from 70.9% in 2003 to 63.6% in 2014/15. This has been as a result of the higher cost of mortgage lending for first time buyers and the rapid increase in house prices, exacerbated by the decline in the incomes of younger people, aged 28-40, relative those aged 40-65. The decline in home ownership amongst young people has been more than 20% in 12 years.

However, rather surprisingly, the Review suggests that high property prices are a result of rising household incomes, high employment and falling interest rates rather than a lack of housing supply, which it argues has been broadly in balance with new household formation over the last 20 years. It suggests that if conditions remain broadly the same, the rate of decline in homeownership will actually stabilise in the near term.

June 2017  Missing Movers

A report for the Council of Mortgage Lenders. A Long-Term Decline in Housing Transactions?

Missing Movers 

Cash Buyers.

2017. Housing White Paper: Fixing our broken housing market. 7 February 2017.

Fixing our Broken Housing Market

2018 Independent Review of Build Out Rates Draft Analysis Rt Hon Sir Oliver Letwin MP

Letwin Identifies the Problem but misses the Solution. 

Independent Review of Build Out Rates Draft Analysis 4.2 In my letter to the Chancellor and the Secretary of State of 9 March, I set out in the following terms what then appeared to me to be the fundamental explanation for the phenomenon: The fundamental driver of build out rates once detailed planning permission is granted for large sites appears to be the ‘absorption rate’ – the rate at which newly constructed homes can be sold into (or are believed by the house builder to be able to be sold successfully into) the local market without materially disturbing the market price. The absorption rate of homes sold on the site appears, in turn, to be largely determined at present by the type of home being constructed (when ‘type’ includes size, design, context and tenure) and the pricing of the new homes built. The principal reason why house builders are in a position to exercise control over these key drivers of sales rates appears to be that there are limited opportunities for rivals to enter large sites and compete for customers by offering different types of homes at different price-points and with different tenures.

Independent review of build out: final report

Sir Oliver Letwin's final report on how to close the significant gap between housing completions and the amount of land allocated or permissioned.Build out rates on large sites

 1.4 The quantitative results of my investigation are set out in Chapter 3 of the Draft Analysis, and full data are provided in Annex A of the Draft Analysis.

1.5 I found that the median build out period on the large sites I investigated was 15.5 years. To put this another way, the median percentage of the site built out each year on average through the build out period on these 15 large sites was 6.5%. By cross-checking against a Molior data-set for other large sites in London kindly provided by the Mayor, I confirmed that the sites in my sample were not atypical and that, if anything, they were being built out at a faster rate than other large sites. The median percentage annual build out rate for London sites of over 1,000 homes in the Molior data-set was 3.2%.

 1.6 It is worth restating this point: very large sites will almost always deliver a higher absolute number of homes per year than sites with only a few hundred homes in total; but the proportion of the site built out each year is likely to be small. Fundamental explanations

 1.7 I concluded in the Draft Analysis that the homogeneity of the types and tenures of the homes on offer on these sites, and the limits on the rate at which the market will absorb such homogenous products, are the fundamental drivers of the slow rate of build out.  

c. if either the major house builders themselves, or others, were to offer much more housing of varying types, designs and tenures including a high proportion of affordable housing, and if more distinctive settings, landscapes and streetscapes were provided on the large sites, and if the resulting variety matched appropriately the differing desires and financial capacities of the people wanting to live in each particular area of high housing demand, then the overall absorption rates – and hence the overall build out rates – could be substantially accelerated.

2018  Building for the Baby Boomers

2019 Independent review of Affordable Supply of Homes Wales.

2019 Tackling the UK housing crisis: is supply the answer? Ian Mulheirn August 2019

April 2019 Last Time Buyers

2019 The-changing-shape-of-the-UK-mortgage-market

6.4 What implications might there be if the changes

being seen to continue?

1. The primary challenge is that the base of mortgaged homeowners is 13 per cent

lower than a decade ago and is still shrinking. We have seen most of the upside

effect on mortgage volumes from low-interest rates and the recovery in house

prices since 2013. Short-term prospects for the wider economy look challenging, with

global growth prospects fading on rising trade tensions and Brexit upheavals closer

to home. If the strong increase in FTB numbers over recent years comes to an end,

then the future growth of the mortgage market will largely depend upon providing new mortgages to existing homeowners and especially later-life households. Older

households have significant housing equity, so we will see further growth in equity

release products.

2. In the absence of continued growth in mortgage debt, competition between

mortgage lenders will intensify and the perceived attractiveness of higher-risk

and niche business areas will increase.

3. Technology and the availability of data and information will support the ability of

lenders to do more business directly with consumers which may impact/call into

question the dominance of mortgage intermediaries over mortgage distribution.

4. Housing transactions have plateaued and turnover, relative to the size of private

housing stock is close to historical lows. This makes for a relatively illiquid and

inefficient housing market, and one where it is difficult for households to find suitable

properties to buy. FTBs, for example, are thinking longer term and waiting to buy

larger homes than they may have done in the past. Longer mortgage terms and lower

inflation mean households need to stay for longer to pay down debt to a level where

they are able to trade up or move to a better area. Compressed property prices limit

the ability to release equity from trading down, opening up the opportunity in the

later life lending market.

5. Housing and mortgage markets have become dependent on government

interventions. This is most obvious in the case of the HTBEL scheme, the proposed

phasing out of which from 2021 onwards threatens to be disruptive unless alternative

replacement solutions that can deliver a similar impact are found. London HTB

fulfils a clear purpose in this context, and this suggests that its closure is likely to be

problematic as the market adjusts to the ending of HTBEL in 2023.

6.5. How might regulators and policymakers use this

information?

1. The housing and mortgage markets are closely inter-linked and there is a growing

complexity to policy changes which requires improved long-term coordination

of housing policy and mortgage regulation at both national and devolved

administration level.

2. Government should recognise that large-scale housing market interventions have

become embedded into current market conditions and that policy needs to evolve

rather than change abruptly if it wishes to avoid market disruption. This is most

obvious in the case of HTBEL, where policymakers have a role in promoting market

alternatives.

3. Government interventions need to be more aligned and considered against the

wider market impacts across markets and tenures. For example, policy changes that

reduce demand from private sector landlords and result in net dis-investment from

the market could reduce the availability of rental supply for those unable to buy while

pushing rental values higher. In a different vein, it would be helpful if government

provided a clear framework for its tax policies and the market impacts, especially with

regards to transaction taxes and the impact on market liquidity.

4. All parties need to recognise the growing polarisation of society along intergenerational lines and show appropriate degrees of flexibility and sensitivity

around this. Younger households face real dilemmas when it comes to housing

choices, especially in cases when they cannot expect significant family support, and

these may have repercussions for their well-being and life choices for decades to

come.

The FPC policies give this aspect of the market no weight when setting macroprudential policy, and, if necessary, the Committee’s remit could be widened to

support government policy in this area. There is a need to reach a consensus view as

to what is a reasonable affordability hurdle for renters to satisfy, if we are to avoid

large-scale rental prisoners. It should be possible to nuance the FPC’s housing levers

to take on board FTB considerations or regional divergences in a way that is still

compatible with the broad thrust of its macro-prudential policy and avoiding overindebtedness.

5. There is a need for all parties to think about what else can be done to help later-life

households draw on housing equity or other sources of finance to support their

living costs in retirement, help family members and live independently in suitable

homes for as long as possible.

2020    First Homes: consultation

2020  Thinking outside the box Exploring innovations in affordable home ownership

Christine Whitehead and Peter Williams London School of Economics 11 November 2020

2021 The Bacon Review

Self-build and custom housebuilding independent review

May 2022 Bringing It Home: Raising Home Ownership by Reforming Mortgage Finance

 IAN MULHEIRN JAMES BROWNE CHRISTOS TSOUKALIS.

https://institute.global/policy/bringing-it-home-raising-home-ownership-reforming-mortgage-finance

Conventional wisdom looks to housing supply to increase home ownership. But there is no compelling reason to think that raising the rate of supply will change the pattern of who owns property. Well-established empirical evidence shows that significantly higher supply will have only a modest impact on house prices over a generation. And, in any case, house prices themselves are not the most important factor in determining home ownership. Almost all first-time buyers (FTBs) rely on mortgage finance to buy, so what matters for raising levels of home ownership is who is able to borrow.

https://www.ukfinance.org.uk/news-and-insight/blog/mortgage-market-forecast-be-weaker-amid-affordability-pressures

 In the face of the ongoing cost-of-living squeeze and rising interest rates, we expect a softer market for house purchases.

- Housing and market forecasts for 2023 and 2024

Identifying the Key Players

Cash Buyers and Mortgaged Movers.

In terms of movers the most buoyant group since the recession has been cash buyers.

In 2016, accounting for 440,000 transactions – a 35% share and 20,000 more than in

2007 – cash buyers were the largest buyer group.

But unpicking the characteristics of this group is tricky. Cash buyers are most often

treated as a residual – total transactions less mortgaged transactions. This covers a

broad range - from overseas buyers of London new build to older downsizers in the

South West and investors in the North East.

Using a range of data sources for a two-year period covering 2014 and 2015, we have

attempted to sub-divide the broad grouping of cash buyers. This analysis showed that

the average number of cash transactions across the two years (439,000 p.a.) can be

divided into four separate groups. These were:

• 30,000 first-time buyers with no mortgage

• 210,000 movers with no mortgage

• 103,000 buy-to-let with no mortgage

• 96,000 other unclassified transactions which involve the buying and selling of whole

or part of a property but fall outside of the three definitions above.

Linda and John

John was born in 1956 and married Linda in 1979. They bought their first home a

year later for £15,200 with a deposit of £2,400. Mortgage rates were high (15%), but

borrowing just 1.7 times their income and Mortgage Interest Relief At Source (MIRAS)

meant repayments cost 20% of their gross income.

By 1988 their two children were aged 4 and 2 and it seemed a good time to move.

Their house had increased in cash terms by 121% which meant their equity had

increased by 838%. Due to high general inflation their household income had doubled

and their mortgage repayments had fallen by more than half. Lower mortgage rates (11%)

and the increase in their income meant they could borrow substantially more than when

they first bought.

The substantial equity and the increase in what they could borrow gave them a budget

of £55,300 to buy a home – 65% more than their existing home. It was more than

enough to get the extra bedroom and bigger garden they wanted.

April 2019 Last Time Buyers

Last-time buyers The challenges and opportunities for 55+ home-owners wanting to move home

Far from being a niche sector, “last-time buyers” – home-owners who are aged

55 or older and who move property – now total about 200,000 each year. Their

numbers have doubled within a decade. They account for one in three of all

moves into or within the owner-occupied sector.

The Government may not find it easy to support last-time buyers financially,

because of inter-generational sensitivities about helping those who are already

fortunate enough to be home-owners, and this makes it even more important

that the mortgage lending industry looks to what it can do.

• The financial innovation around lifetime mortgages, lending into retirement and,

more recently, retirement interest-only mortgages, allied with efforts to provide

advice within an increasingly holistic context, have all been positive

developments in this respect, but more can and will be achieved.

• A better flow of household finance will encourage house-builders to prioritise

last-time buyers in their planning. With collaboration across all stakeholders, this

part of the housing market has strong upward growth potential.

Outright owners

With older home-owners accounting for a growing share of overall home-

ownership and housing equity, and the lion’s share of those who own their

homes outright, it should come as little surprise that cash has become more

prevalent among this group over recent years.

Yet last-time buyers each year still only represent about 21⁄2% of the 8 million or

so older home-owners. Various surveys suggest that many more such

households are interested in the idea of moving, but face a number of

headwinds.

• The principal obstacle seems to be a lack of suitable properties to buy. Relatively

few older home-owners actually need to move for health or other personal

reasons (that is a hallmark of later years), and for the vast majority any move is

aspirational in nature and focused on the mainstream housing market.

• Most would-be last-time buyers are keen to find a home that is more

manageable, energy-efficient and low maintenance.

• This should be a golden opportunity for the new-build sector, but strangely,

house-builders appear to have been slow to develop and market homes for last-

time buyers. This may be a policy area where the Government, working closely

with the lending and house-building sectors, needs to kick-start activity, much as

it did for first-time buyers with its Help to Buy initiatives.

Banks and Building societies , market Shares and Lending breakdown vis Total Market Value?

Statistics on mortgage lending: Q3 2022 edition

The latest commentary and full statistical tables are available below. The commentary includes

technical information on the MLAR as well as analysis of the findings.

Commentary on the statistics

.Latest findings

The outstanding value of all residential mortgage loans was

£1,667.1 billion

at the end of 2022 Q3, 4.1% higher than a year earlier.

The value of gross mortgage advances in 2022 Q3 was £85.9 billion, which was £8.0 billion

greater than the previous quarter, and 17.0% higher than in 2021 Q3.

The value of new mortgage commitments (lending agreed to be advanced in the coming months)

in 2022 Q3 was 4.5% greater than the previous quarter and the highest value recorded since

2007 Q3.

Key information

Since the beginning of 2007, around 340 regulated mortgage lenders and administrators have

been required to submit a Mortgage Lending and Administration Return (MLAR) each quarter,

providing data on their mortgage lending activities.

The FCA and the Prudential Regulatory Authority (PRA) both have responsibility for the regulation

of mortgage lenders and administrators so this data publication is joint. We publish this data

every quarter.

Mortgage industry of the United Kingdom

The mortgage industry of the United Kingdom has traditionally been dominated by building societies, the first of which opened in Birmingham in 1775.[1] But since the 1970s, the share of new mortgage loans market held by building societies has declined substantially. Between 1977 and 1987, the share fell drastically from 96% to 66%, and that of banks and other institutions rose from 3% to 36%. The major lenders include building societies, banks, specialized mortgage corporations, insurance companies and pension funds. During the four years after the financial crisis of 2008, the UK mutual sector provided approximately 80% of net lending to the housing market.[2] There are currently over 200 significant separate financial organizations supplying mortgage loans to house buyers in Britain, with Lloyds Bank and the Nationwide Building Society having the largest market share.

https://www.statista.com/statistics/727348/uk-banks-gross-lending-market-share/

There’s more to house prices than interest rates

The average house in the UK is worth ten times what it was in 1980. Consumer prices are only three times higher. So house prices have more than trebled in real terms in just over a generation. In the 100 years leading up to 1980 they only doubled. Recent commentary on this blog and elsewhere argues that this unprecedented rise in house prices can be explained by one factor: lower interest rates. But this simple explanation might be too simple. In this blog post – which analyses the data available before Covid-19 hit the UK – we show that the interest rates story doesn’t seem to fit all of the facts. Other factors such as credit conditions or supply constraints could be important too.

So what might the framework be missing?

All economic models involve abstractions and simplifications – if they didn’t they would be useless. But given the importance of housing to economic growth and people’s wellbeing, and that changes in house prices could impact financial stability, we need a model that captures the key drivers.

There could be a role for changes in credit conditions. The framework assumes that people are not credit constrained, meaning they can exploit arbitrage opportunities by buying up rental properties. If there are frictions in practice, this could mean that credit conditions matter for house prices. Mortgage debt expanded rapidly as house prices rose in the UK before the crisis, so this could be an important channel for the UK.

The framework does not include an explicit role for supply elasticity. In practice, evidence suggests that housing supply responds very differently to prices in different countries and regions. The Barker review of UK housing supply pointed to low elasticity of supply in the UK. Where supply elasticity is low, as is the case in the UK, the same change in rates will have a larger impact on prices and rents. More work is likely required to document UK supply elasticities in detail and to explore what different elasticities have meant for growth in prices and rents over time and across places.

It’s hard to measure how expectations and risk premia vary over time and place but this could be important. Within the framework, an increase in rental growth expectations or a fall in risk premium would imply an increase in price. There is some evidence to suggest that returns on housing have been similar to other risky assets and relatively constant over the long term.

Other relevant factors might include maintenance costs and taxes. Maintenance costs have risen in line with inflation in the UK. UK property taxes are small and have been relatively flat – but there is evidence that higher taxes would likely reduce house prices. All of these are subject to considerable uncertainty.

Local Authorities, Housing Associations , The Social Housing Stock

Stock transfer[edit]

The Housing Acts of 1985 and 1988 facilitated the transfer of council housing to not-for-profit housing associations. The 1988 Act redefined housing associations as non-public bodies, permitting access to private finance, which was a strong motivation for transfer as public sector borrowing had been severely constrained. These housing associations were also the providers of most new public-sector housing. By 2003 36.5% of the social rented housing stock was held by housing associations.[50] In some council areas referendums on changing ownership were won by opponents of government policy, preventing transfers to housing associations.[51]

The Wakefield district council found itself unable to maintain its supply of council housing and transferred it all to a housing association in 2004; this represented the second largest stock transfer in British history. Housing rented from the council accounted for about 28% of the district and around 40% of the actual city of Wakefield.[52]

Many districts of the country have less than 10% of housing rented from the council; the national average stood at 14%.[51]

The Private Rental Stock, BTL mortgage Growth

First Time Buyers and Student Debt burden.

The impact of student housing on rental markets in the UKby Benedict Wiggins,

2 December 2018 by Fiona

Does Student Loan Debt Structure Young People’s Housing Tenure? Evidence from England

Published online by Cambridge University Press:  26 January 2021 ARIANE DE GAYARDON CLAIRE CALLENDER and STEPHEN L. DESJARDINS

https://www.cambridge.org/core/journals/journal-of-social-policy/article/abs/does-student-loan-debt-structure-young-peoples-housing-tenure-evidence-from-england/7DA85B6088D211EF0A8D9C4E1EFC6DDA

 We find that young graduates who did not borrow for higher education are more likely to own their home and less likely to rent or live with their parents than graduates who borrowed for their studies or young people who never attended higher education. These results suggest that higher education funding policies and student loan debt play important roles in structuring young people’s housing in England.

DE GAYARDON, A., CALLENDER, C., & DESJARDINS, S. (2022). Does Student Loan Debt Structure Young People’s Housing Tenure? Evidence from England. Journal of Social Policy, 51(2), 221-241. doi:10.1017/S004727942000077X

2 These policies aim to shift more HE costs from government to students. As study costs have risen, so has reliance on student loans. All English domiciled full-time undergraduates qualify for loans covering all their tuition fees and means-tested maintenance loans towards their living costs. In 2017-18, with tuition fees of £9,250 and no maintenance grants, 94 percent of full-time undergraduates took out a tuition fee loan and 89 percent a maintenance loan (Bolton, 2020). Students today can expect to graduate with average debts over £50,000. Since the abolition of maintenance grants in 2016, student loan debt has become unequally distributed. Students from the poorest 40 percent of families will graduate with average debts of about £57,000, compared with £43,000 for students from the richest 30 percent of families (Belfield et al., 2017a). Students start repaying their loans once they leave HE and their income reaches a threshold. 3 They then pay nine percent of their earnings above the threshold until their loans are paid off, with any outstanding debt forgiven after 30 years. The more graduates earn, the larger their repayments, making the repayment system progressive and protecting low-earning graduates from high repayments. An estimated 83 percent of graduates will not repay their loan in full within 30 years (Belfield et al., 2017b). Consequently, most students will be repaying their debts for most of their working lives. Significantly, monthly repayments deducted from graduates’ pay packet are dictated by graduates’ earnings and not the total amount borrowed, unlike time-based repayment schemes found, for instance, in the United States (US) where repayments are not linked to a graduates’ capacity to repay. In an income-contingent plan, large student loans increase the time it takes to pay them off, but not monthly loan repayments. These design features of income-contingent loans might protect graduates and render their student debt irrelevant to their housing options. Alternatively, the fact that most graduates will be saddled with loan repayments for most of their working lives might matter for their financial resources. Moreover, the psychological burden of carrying debt – which can shape students’ HE decisions (e.g. Callender and Mason, 2017) – might influence housing options too.

The Planning system, Land Reform, Land Ownership, Consented Plots

Independent Review of Build Out Rates

Draft Analysis

Rt Hon Sir Oliver Letwin MP

Volume House builders and the “Absorption Rate” Letwin.

The fundamental driver of build out rates once detailed planning permission is granted for large sites appears to be the ‘absorption rate’ – the rate at which newly constructed homes can be sold into (or are believed by the house builder to be able to be sold successfully into) the local market without materially disturbing the market price. The absorption rate of homes sold on the site appears, in turn, to be largely determined at present by the type of home being constructed (when ‘type’ includes size, design, context and tenure) and the pricing of the new homes built. The principal reason why house builders are in a position to exercise control over these key drivers of sales rates appears to be that there are limited opportunities for rivals to enter large sites and compete for customers by offering different types of homes at different price-points and with different tenures.

4.15 The value-unaffecting rate of sale that avoids all of these effects is what the house builders, the land agents, the council planners – and indeed independent commentators such as the OFT – call the ‘absorption rate’ for homes on a large site by the local market. They do not actually mean the absolute absorption rate in the sense of the rate at which the market will absorb the homes at any price, or even the construction-cost-relative absorption rate at which the market will absorb the homes if they are sold at or near to the cost of construction (including the cost of capital). They mean, instead, the rate at which new homes can be absorbed without reducing the price of the homes below the price assumed for the purposes of the land valuation.

Demographic change, Aging population and Immigration.

Building for the Baby Boomers Making a housing market for an ageing population Jack Airey

Debates around the ‘housing crisis’ tend to centre on the experiences of younger people, but some of its most acute impacts are felt by older generations. While many older people will be able to live happily and independently with relatively little change, through continued health and adaptations to their existing homes, many would prefer to move to a home more suited to age-related health and care requirements. To support this there is a pressing need for more homes specifically aimed at older people with greater choice in their cost, design and tenure. Currently it is only wealthy homeowners who are catered for by the retirement housing market. The aim must be increasing housing choice in later life for people of all financial means. As the UK population continues to get older, with people living longer and more to a very old age, this report puts forward a policy programme for a retirement housing market more characterised by competition and choice. We make recommendations to Government, local authorities and developers. The report’s foreword is written by Lord Richard Best, CoChair, All Party Parliamentary Group on Housing and Care for Older People

Immigration.

Housing Market Volume 825: debated on Thursday 17 November 2022

“That this House takes note of the multiple problems affecting all tenures in the housing market in England; and the case for a coherent strategy to encompass the social, economic, and environmental aspects of housing and construction”

Lord Lilley (Con) given that the rate of births is below the rate of deaths. We are not creating more households domestically to create this demand for housing. Until recently, the main driver of demand for housing was that households were becoming smaller. As people left home earlier or lived longer after their children had left home, so that there were only two instead of four in the household, or after their partner had died, so that there was only one instead of two, average household size was coming down. This was also aggravated by the sad break-up of families through divorce or separation.

 That used to mean we had to add 0.5% to the housing stock every year to cope with smaller households. That has come to an end.

Young people are now unable to leave home and are leaving later.

 In 1999, 2.4 million adults aged between 20 and 34 lived at home with their parents.

By 2019, 3.5 million people in that age group lived at home with their parents.

So what is the reason?

 The main reason, which I suspect no one else in this debate will mention, is not migration into the south of England or London from the rest of the United Kingdom. That is often the reason given, but in the last two or three decades there has been a net outflow from London and south-east England to the rest of the UK. The inflow is from abroad.

We have seen mass immigration into this country on a scale never before seen in our history. We know that the official figures from the last decade understate the numbers coming here. We found, when we asked European residents to register, that there were 2 million more of them than we knew about. Over the last decade, the official figures show a net increase to our population of 2 million from those coming to settle here from abroad. That is equivalent to our having to build cities the size of Nottingham, Derby, Leicester, Middlesbrough, Carlisle, Oxford, Exeter, Portsmouth and Southampton, every decade, just to keep up with the net inflow from abroad.

If we allow a continued net inflow of 200,000 or 300,000 into this country, we have to build extra houses on top of the demand of the domestic population that is already here. We can strive to reduce the inflow, but we will still have to build a lot of houses and there will still be a lot of objections to that housebuilding. I do not mind which side of the debate people take, as long as they are honest about it.

If they say, “We want to see mass immigration into this country and we are prepared to build all those extra properties every year—the equivalent of all those cities every decade”, that is fair enough, but they may oppose that.

The treasury and Bank of England.

. Housing Wealth.2021

National balance sheet estimates for the UK 2021.pdf

Housing Wealth 2015.

1 . Main points

The National Balance Sheet is a measure of the wealth, or total net worth, of the UK. It shows the

estimated market value of financial assets, such as loans, and non-financial assets, such as dwellings.

Market value is an estimate of how much these assets would sell for, if sold on the market

The estimates in this release cover the period 1997 to 2014. All data referred to in this bulletin are annual

estimates at current prices

At the end of 2014, the total net worth of the UK was estimated at £8.1 trillion. This was equivalent to an

average of £125,000 per person or £302,000 per household

Dwellings remained the most valuable non-financial asset in the UK at £5.1 trillion, accounting for 63% of

the UK’s total net worth at the end of 2014. Dwellings increased in value by £408 billion (9%) over the

period 2013 to 2014

The households and non-profit institutions serving households (NPISH) sector provided the largest

increase in the total net worth of the UK in 2014. This sector increased in value by £1.03 trillion (12%) over

the period 2013 to 2014

Financial corporations placed the largest downward pressure on the total net worth of the UK between

2013 and 2014. This can be mainly attributed to a decrease of £175 billion (16%) in their estimated

financial net worth of “equity and investment fund shares/units”

The UK national balance sheet estimates 2015 .pdf

Housing Wealth Geographically.

www_savills_co_uk_insight_and_opinion_savills_news_324530_0_.pdf

Housing Wealth Demographically.

last-time-buyers-the-challenges-and-opportunities-for-55-home-owners-wanting-to-move-home-imla-april-2019.pdf

Fiscal policy and Housing Wealth.

Stamp Duty and MIRAS

Transaction costs

Our taxation system confers generous tax advantages on housing wealth and serves

to discourage people from moving home.

Capital gains tax exemption and inheritance tax relief on main homes, together with

the failure of policy-makers to index Council Tax in line with house price inflation, all

encourage people to hold on to their residential property wealth.

While the government has sought to ensure that home-owners selling or downsizing

their homes are not put at a disadvantage with respect to inheritance tax (following the July 2015 Budget changes), public policy does very little at present to incentivize older people to move or downsize.

The transaction costs associated with buying and selling property can be large and

are, in many cases, dominated by stamp duty.

IMLA, like many organisations, believes that stamp duty is a poorly designed tax, which acts as a significant across-

the-board deterrent for those thinking about moving home. Such adverse effects may loom particularly large in the minds of older home-owners for whom such moves are in most cases highly discretionary.

Stamp duty

A number of think tanks and others have proposed cuts in stamp duty or other

concessions to help last-time buyers address high transaction costs and affordability

pressures.

As general relief from stamp duty for older households would risk triggering

concerns about inter-generational unfairness, most proposals in recent years have

been predicated on helping just those home-owners who need to move into

specialist housing, or households looking to move into smaller/cheaper properties(22)

.

While such proposals are well-intentioned, piecemeal reform risks adding further

complexity to the tax treatment of property and also perhaps unintended

consequences, such as seeing the benefit of any change being dissipated in higher

capital values.

More importantly, it is simply not clear whether stamp duty relief would be

transformative. The recent changes in the tax treatment of first-time buyers are

salutary in this respect, with almost no change in first-time buyer numbers last year,

despite the fact that the vast majority of first-time buyers have enjoyed relief from

stamp duty land tax since late 2017.

(22) See for example Building for the Baby Boomers, Policy Exchange, December 2018

A new tax relief for first-time buyers

In Autumn Budget 2017, the Government announced the introduction of a permanent stamp duty land tax (SDLT) relief for first-time buyers. This box considered the effects of a previous temporary relief for first-time buyers and how the new permanent relief was expected to affect tax receipts and house prices.

The Government will introduce a new permanent relief for certain first-time buyers (FTBs) that will reduce stamp duty land tax (SDLT) to zero on properties up to £300,000. A rate of 5 per cent will be charged on the value between £300,001 and £500,000. But FTBs buying a property for £500,001 or more will not benefit from the relief at all, so a purchase at that price would be liable to £5,000 more in SDLT than one at £500,000. Eligibility criteria match those of the post-crisis ‘stamp duty holiday’, although then the relief stopped at £250,000. HMRC published an evaluation part way through that holiday. It concluded that the majority of the value of relief had fed through to higher house prices and that it “has not had a significant impact in terms of improving the affordability of residential property for FTBs. It is estimated that most of the buyers who benefitted from the relief would have purchased property in its absence anyway (i.e. are deadweight).” A Confirmation that the relief would end was announced alongside the evaluation.

Mortgage interest relief at source

From Wikipedia, the free encyclopedia

Mortgage interest relief at source, or MIRAS, was a scheme introduced in the United Kingdom from 1983[1] in a bid to encourage home ownership; it allowed borrowers tax relief for interest payments on their mortgage. Previously tax had to be reclaimed from HMRC [2]

In the 1983 Budget Geoffrey Howe raised the tax allowance from £25,000 to £30,000. Unmarried couples with joint mortgages could pool their allowances to £60,000, a provision known as Multiple Mortgage Tax Relief. This remained in place until the 1988 Budget, when Nigel Lawson ended the option to pool allowances from August 1988. Lawson later publicly expressed regret at not having implemented the change with effect from the time of the budget, as it is generally accepted that the rush to beat the deadline fuelled a sharp increase in house prices.[3]

MIRAS was completely abolished in April 2000 by Gordon Brown, who argued it had become a middle class perk.[4]

Receiving MIRAS was one of the justifications given by mortgage advisers when selling endowment mortgages.[citation needed]

There is a similar scheme in the Republic of Ireland, although not available for mortgages drawn down after 2013.[5]

Further Reading List.

Home@ix Understanding Affordable Homes Finance

http://www.realrld.com/blog/affordable-homes-nothing-new-under-the-sun

https://notthegrubstreetjournal.com/2020/12/13/moduloft-the-affordable-housing-manufacturers-defining-the-terms-of-and-boundary-conditions-of-our-domain/

The financialisation of housing production: exploring capital flows and value extraction among major house builders in the UK . ARCHER, Tom

Written evidence submitted by the Systemic Fiscal Reform Group

https://notthegrubstreetjournal.com/2020/11/22/green-horizons-ngfs-gisd-tvsm-carbon-credits-and-the-uk-mortgage-market-implications-of-sdgs-to-home-owning-democracy-a-moduloft-inquiry/

https://notthegrubstreetjournal.com/2020/07/02/agenda2030-un-sustainable-development-goals-stalinism-and-the-isle-of-dogs-neighbourhood-plan-5g3dmarxism-stevereedmp-mayorjohnbiggs-mayoroflondon-borisjohnson-financialeyes-empty/

https://notthegrubstreetjournal.com/2020/11/23/building-back-better-double-dip-into-carbon-credit-double-dipping-a-moduloft-inquiry/

Footnote.

Analysing Financial, Economic and Capitalist Crisis: Old and New Logics

A Savage Sorting of Winners and Losers: Contemporary Versions of Primitive Accumulation

Saskia Sassen

Pages 23-50 | Published online: 27 Apr 2010

  • Download citation
  •  https://doi.org/10.1080/14747731003593091
  • The Repositioning of Territory in the Global Division of Functions

  • Perhaps less known than the African case is the fact that privatized land in the territories of the former Soviet Union, especially in Russia and Ukraine, is also becoming the object of much foreign acquisition. In 2008 alone, these acquisitions included the following: a Swedish company, Alpcot Agro, bought 128,000 hectares in Russia; South Korea’s Hyundai Heavy Industries paid $6.5 million for a majority stake in Khorol Zerno, a company that owns 10,000 hectares in eastern Siberia; Morgan Stanley bought 40,000 hectares in Ukraine; Gulf investors are planning to acquire Pava, the first Russian grain processor to be floated on the financial markets to sell 40% of its landowning division, giving them access to 500,000 hectares. Also less noticed than the African case is that Pakistan is offering half a million hectares of land to Gulf investors with the promise of a security force of 100,000 to protect the land. These developments are part of a larger combination of trends. First, there is the immediate fact of how the global demand for food, partly fed by the half million strong new middle classes of Asia, has meant that there are profits to be had in food and land.15 We now have a global market for land and food controlled by large firms and some governments, and it has been a growth sector throughout the financial crisis. Under these conditions pricing is a controlled affair. Secondly, there is the ongoing demand for metals and minerals of all sorts and a whole new demand for metals and minerals hitherto not much exploited as their demand comes from the more recent developments in the electronics sector.
  • Sub-prime Mortgages: A New Global Frontier for Finance

  • The 1980s opened a new financial phase that became yet another disciplining mechanism.22 Here it was not structural adjustment programs but financial adjustment crises. Since the 1980s there have been several financial crises, some famous, such as the 1987 New York stock market crisis and the 1997 Asian crisis. And some obscure, such as the individual country financial crises that happened in over 70 countries in the 1980s and 1990s as they deregulated their financial systems, mostly under pressure from global regulators aiming at facilitating the globalizing of financial markets.
  • Conventional data show the post-1997 financial crisis period to be a fairly stable one, until the current crisis. One element in this picture is that after a country goes through an ‘adjustment’ crisis, ‘stability’ (and prosperity!) follow. This then produces a representation of considerable financial stability, except for a few major global crises, such as the dotcom crisis. A much mentioned fact regarding the current 2007 – 2008 crisis intended to show that the system is fine, is that in 2006 and 2007, 124 countries had a GDP growth rate of 4% a year or more, which is much higher than that of previous decades. The suggestion is then that the 2007 – 2008 crisis is precisely that—an acute momentary event, but that the system is fine. But behind this stability lies a savage sorting of winners and losers, and the fact that it is easier to track winners than to track the slow sinking into poverty of households, small firms, and government agencies (such as health and education) that are not part of the new glamour sectors (finance and trade). The miseries these adjustment crises brought to the middle sectors in each country and the destruction of often well-functioning economic sectors is largely an invisible history to the global eye.
  • What stands out in this phase that begins in the 1980s is that global and adjustment crises had the effect of securing the conditions for globally linked financial markets and the ascendance of a financial logic organizing larger and larger sectors of the economy in the global North. In this process large components of the non-financial economy in these countries were ruined.24 Against this background, the current financial crisis is yet another step in this trajectory. One question is whether it spells the exhaustion of this trajectory, or rather the beginning of its decay. In what follows I argue that the specific way of using the sub-prime mortgage in the 2001 – 2007 period makes it a dangerous instrument that is likely to be used worldwide over the next decade. It is a mistake to see this instrument as having to do with providing modest income households with housing. It has rather to do with a structural condition of high finance marked by the combination of a growing demand for asset-backed securities given extremely high levels of speculative investments. This structural condition is at the heart of the actual event that momentarily brought the system to a (partial) standstill—the credit-default swap crisis of September 2008— which in turn suggests an even keener interest in asset-backed securities, and hence in the speculative use of sub-prime mortgages. I see this as one of the new global frontiers for finance, specifically, the 2 billion modest-income households worldwide. The effect could be yet another brutal sorting, with expulsions from more traditional economies, not unlike the consequences of the structural adjustment crises in the global South discussed in the first half of this paper.
  • I begin with a quick comparison of the major global crises since the current phase began in the 1980s to underline the extent to which financial leveraging has caused the greater acuteness of the current crisis compared with the other 3 major global crises since the 1980s. Figure 2 shows that financial leveraging added another 20% to the underlying banking crisis, thereby bringing the current financial crisis up to an equivalent of 40% of global GDP, compared to earlier crises, which rarely went beyond 20%.
  • securities by investors, in a market where the outstanding value of derivatives was $630 trillion, or 14 times the value of global GDP. The total value of financial assets (which is a form of debt) in the US stood at almost five times (450%) the value of its GDP in 2006, before the crisis was evident. The UK, Japan, and the Netherlands, all had a similar ratio (McKinsey & Company, 2008, p. 11).25 From 2005 to 2006 the total value of the world’s financial assets grew by 17% (in nominal terms, 13% at constant exchange rates) reaching $167 trillion. This is not only an all-time high value; it also reflects a higher growth rate in 2006 than the annual average of 9.1% since 1980. This points to growing financial deepening. The total value of financial assets stood at $12 trillion in 1980, $94 trillion in 2000, and $142 trillion in 2005.
  • There is a profound irony in this crisis of confidence: the brilliance of those who make these financial instruments became the undoing of a large number of investors (besides the undoing of the modest-income families who had been sold these mortgages). The toxic link was that for these mortgages to work as assets for investors, vast numbers of mortgages were sold regardless of whether these home-buyers could pay their monthly fee. The faster these mortgages could be sold, the faster they could be bundled into investment instruments and sold off to investors. Overall, sub-prime mortgages more than tripled from 2000 to 2006, and accounted for 20% of all mortgages in the US in 2006. This premium on speed also secured the fees for the sub-prime mortgage sellers and reduced the effects of mortgage default on the profits of the sub-prime sellers. In fact, those sub-prime sellers that did not sell off these mortgages as part of investment instruments went bankrupt eventually, but not before having secured fees. In brief, the financial sector invented some of its most complicated financial instruments to extract the meager savings of modest households in order to produce an ‘asset’—the mortgage on a house. The complexity of the financial innovation was a series of products that de-linked sub-prime sellers and investors’ profits from the creditworthiness of consumer home mortgage-buyers. Whether the mortgage is paid matters less than securing a certain number of loans that can be bundled up into ‘investment products’. The crisis of home-buyers was not a crisis for financial investors, even though millions of middle and working class families now live in tents in the US. For finance it was a crisis of confidence. But it showed the importance of the systems of trust that make possible the speed and orders of magnitude of this financial system. The crisis of home-owners (valued at a few hundred billion dollars) was the little tail that dented the enormous dog of trust in the financial system. In other words, this type of financial system has more of the social in it than is suggested by the technical complexity of its instruments and electronic platforms (Sassen, 2008a, pp. 355– 365). The critical component that brought the financial system to a momentary standstill was more of an old-fashioned speculation gone wrong: the $62 trillion dollar credit-default swap crisis that exploded on the scene in September 2008, a full year after the sub-prime mortgage of August 2007 (see Figure 4). This was more than the combined domestic product of all countries in the world, $54 trillion. Figure 4 shows the extremely sharp growth over an extremely short period of time, from 2001 to 2007. While much attention has gone to sub-prime mortgages as causes of the financial crisis, the $60 trillion in swaps in mid-2008 is what really got the financial crisis going. Declining house prices, high foreclosure rates, declining global trade, rising unemployment, all alerted investors that something was not right. This, in turn, led those who had bought credit-default swaps as a sort of ‘insurance’ to want to cash in. But the sellers of these swaps had not expected this downturn or the demand to cash in from those whom they had sold these credit-swaps. They were not ready, and this catapulted much of the financial sector into crisis. Not everybody lost. Among the winners are also those who ‘shorted’ sub-prime mortgage securities: once again, Soros is the emblematic actor in this parallel circuit, making well over $3 billion on the sub-prime mortgage crisis, just as he did on the British pound’s fallout from the European Exchange Rate Mechanism (ERM).
  • This shadow banking system has thrived on the recoding of instruments, which, at the limit, allowed illegal practices to thrive. For instance, it is now clear that credit-default swaps were sold as a type of insurance. But rather they were actually derivatives. If they would have been sold as insurance the law requires they be backed by capital reserves and be subject to considerable regulation. Making them into derivatives was a de facto deregulation and eliminated the capital reserves requirement. Credit-default swaps could not have grown so fast and reached such extreme values if they had been sold as insurance, which would have been the lawful way. None of the financial firms had the capital reserves they would have needed to back $60 trillion in insurance. Because they were recoded as derivatives, they could have an almost vertical growth curve beginning as recently as 2001.
  • A comparison of the value of all residential mortgage debt (from high to low-quality mortgages) as a ratio of national GDP across developed countries shows sharp variations.27 To some extent, the variation in this value is a function of timing. In the US, the UK and Australia, the housing market has long been private and, importantly, the financial system is highly developed on a broad range of fronts. Thus the incidence of mortgages is both high and widespread in terms of the variety of financial circuits it encompasses. Central to this story is the difference between the value of housing loans as a ratio to GDP and the growth rate of such loans. Thus, the former is very low in countries with young housing markets, such as India and China, where it stands at 10%.28 In contrast, in more mature markets in Asia, this value can be much higher—standing at 60% in Singapore, and 40% in Hong Kong and Taiwan—but the growth rate is much lower.
  • The next two tables (Tables 5 and 6) provide comparative data on the incidence of residential loans to total loans in several highly developed and so-called emerging market countries. These two tables also help situate the residential mortgage market in the rapidly growing and diversifying financial world of loans. Developed countries with multiple financial circuits, such as the US and the UK, clearly show that compared to other types of loans, mortgages are a relatively small share of all loans, even if most households have mortgages. It is important to note that the same low level of mortgage loans to total loans in economies marked by a small elite of super rich individuals has a different meaning in the US and UK: hence, Russia’s extremely low
  • the ratio of finance as a whole to US GDP is 450%, as it is for the UK. The other story, then, is the extent to which finance has found mechanisms for raising its revenue that have little direct connection to the material economy of countries. In this regard, the securitizing of residential mortgages can be seen as a powerful instrument for the further financial deepening of economies. Finally, yet another way of understanding the mortgage capital is its share in total loans. Tables 5 and 6 show this share for developed and emerging market economies. There is considerable variability within each group of countries. But the general fact is that there is much room for residential mortgage debt to grow in both. And some of this growth may well take the shape of sub-prime mortgages, with its attendant risks for modest-income households and the added leveraging it brings to the financial system.
  • Driven by Mortgages, U.S. Household Debt Hits New High

  • HOUSEHOLD DEBT

  • by Felix Richter, 
  • Aug 26, 2021
  • U.S. household debt climbed to a record high of $15.0 trillion in the second quarter of 2021, as mortgage debt climbed to $10.4 billion amid a refinancing boom. According to the New York Fed’s latest Household Debt and Credit Report, mortgage debt increased by a whopping $282 billion between April and June.
  • A Decade after the Crisis, Has the Global Debt Burden Stabilized?

  • October 17, 2019
  • Conclusion: The Expulsion of People and the Incorporation of Terrain

  • The potential for global replication of the financial innovation that destroyed 15 million plus households in the US, therewith devastating whole neighborhoods is the systemic equivalent, albeit on a much smaller scale, of the global South countries devastated by an imposed debt and debt servicing regime which took priority over all other state expenditures. These are two manifestations of a systemic deepening of advanced capitalism, one marked by its potential to spread globally and the other marked by its full enactment in the global South.
  • I see the sub-prime mortgage as extending the domain for high finance but in a way that delinks the financial circuit from the actual material entity that is the house, and hence from the neighborhood, and from the people who got the mortgage.
  • It is akin to wanting only the horns of the rhino, and throwing away the rest of the animal, devaluing it, no matter its multiple utilities. Or using the human body to harvest some organs, and seeing no value in all the other organs, let alone the full human being—it can all be discarded. But unlike the clear realignments we see in vast stretches of the global South, it is not clear how these devastated urban spaces in the global North will be incorporated into the circuits of advanced capitalism. This systemic shift signals that the sharp increase in displaced peoples, in poverty, in deaths from curable illnesses, are part of this new phase. Key features of primitive accumulation are at work, but to see this it is critical to go beyond logics of extraction and to recognize the fact of systemic transformation, with its system-changing practices and projects—the expulsion of people that transforms space back to territory, with its diverse potentials.
  • https://notthegrubstreetjournal.com/2020/01/05/161-a-welcome-initiative

UK HOUSING REVIEW 2022

0 Comments

    Author

    Roger Lewis, CEO of Home@ix writes this Blog, and the opinions expressed are his alone.

    Archives

    March 2023
    January 2023
    December 2022
    November 2022
    October 2022
    June 2022
    April 2022
    February 2022

    Categories

    All

    RSS Feed

Proudly powered by Weebly
  • Home@ix Home Page
  • Land Requirements
  • Real Estate Land and Developments Limited
  • Contact
  • Blog